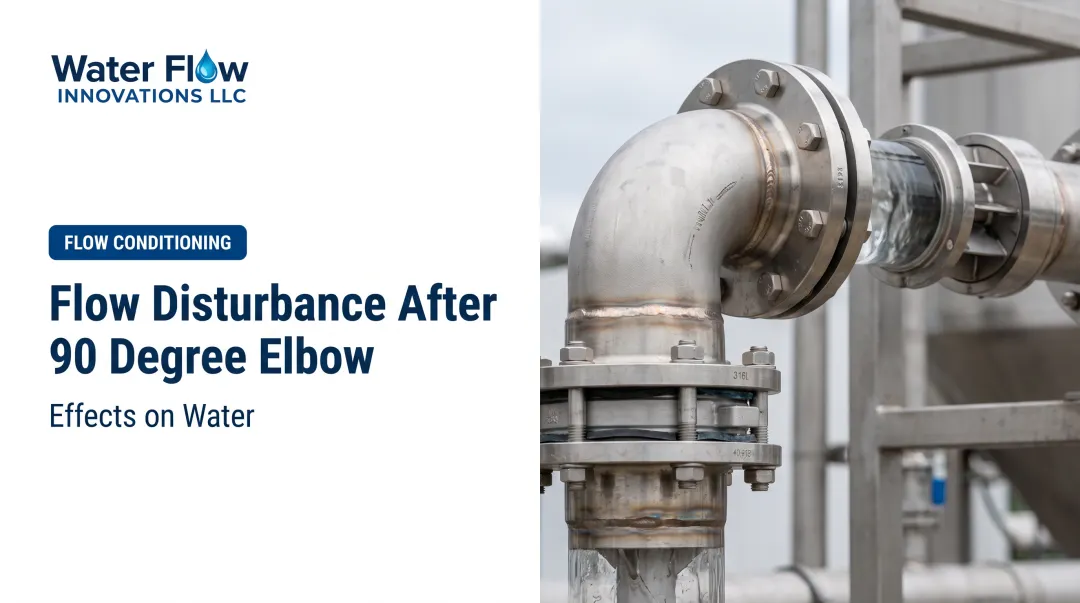

Many facility teams struggle to explain why metered usage doesn't match actual consumption. A big piece of that puzzle sits just downstream of the nearest elbow. Distorted flow throws off pressure drop calculations, stresses piping unevenly, and — critically — confuses water meters that were calibrated for smooth, symmetric flow.
This article breaks down what a velocity profile actually is, how an elbow wrecks it, which variables make it worse, and what that means for your utility bills.
Key Takeaways
- Elbows create asymmetric, skewed velocity profiles—not straight-pipe flow.
- Full profile recovery can take 10 to 70+ pipe diameters after a bend.
- Disturbed flow at meters causes over- or under-registration by meter type.
- Straight runs and flow conditioning devices are the standard fixes.
What Is a Velocity Profile and How Does an Elbow Disrupt It?
A velocity profile maps how fast fluid moves across a pipe's cross-section. In laminar flow, it's parabolic: fastest at the center, slowest at the walls. Turbulent flow flattens that curve — blunter in the middle, with steep gradients confined to a thin layer near the wall.
An elbow throws this off entirely. As fluid rounds the bend, inertia pushes the faster core toward the outer wall while flow near the inner wall separates, creating recirculation zones and a lopsided velocity distribution.
Secondary Flow and Turbulence Spikes
Beyond the skew, elbows generate Dean vortices — a pair of counter-rotating swirls that form in the plane perpendicular to flow. A 2025 CFD study traced their development to between 30 and 60 degrees through the bend, fully formed by the outlet (Frontiers in Mechanical Engineering, 2025). These vortices send fluid downstream in a helical path rather than a straight line.

Turbulence intensity spikes right after the bend too. Where exactly the stress concentrates depends on the model:
- Baseline CFD models (RNG, standard k-epsilon) place peak wall shear stress and turbulent kinetic energy on the inner radius near the elbow entrance
- A realizable k-epsilon model shifts the primary peak toward the outer radius near the exit, while retaining a secondary peak inside near the entrance
Both patterns are documented in Sandia's CFD work on pipe elbow flow. The takeaway: don't assume the outer wall always takes the worst of it. Model choice and specific geometry matter.
How Long Until Flow "Normalizes"?
This is where things get less tidy than most rules of thumb suggest. A 2024 study found mean-velocity recovery ranging from 10 to 40 pipe diameters at Reynolds numbers of 5,600 to 10,000, with higher Re recovering faster.
A separate 2007 experiment found disturbance persisting well beyond 50 diameters for tighter bends, and detectable out to 70D for the tightest radius tested.
Developing length depends heavily on Reynolds number, bend radius, and recovery criterion. Ten diameters is a common placement rule, not proof of fully redeveloped flow.

Factors That Influence the Post-Elbow Velocity Profile
Elbow Geometry and Radius of Curvature
Tighter bends (lower radius-to-diameter ratios) force a more abrupt direction change, triggering greater separation. Key geometry effects include:
- Below about Rc/D = 2.5, separation losses rise sharply as the turn gets tighter
- Very large radius ratios can raise friction losses again because the fluid travels a longer curved path
- Long-radius elbows usually separate less and recover sooner than short-radius fittings
A DOE study at Re = 2.5 million found a Rc/D = 1.2 elbow produced about 40% more pressure loss than a Rc/D = 1.5 elbow. Longer is often better for recovery, but oversized curvature is not automatically ideal.

Flow Rate and Reynolds Number
Higher velocities sharpen velocity gradients and intensify downstream turbulence. Smaller pipes running at high velocity typically show more severe distortion than larger pipes at comparable flow rates, simply because the same disturbance occupies a larger share of the cross-section.
Fluid Viscosity
Viscosity controls how readily secondary flows and vortices persist after the bend. More viscous fluids damp turbulence formation. Low-viscosity fluids like water develop swirl and secondary flow more easily, so distorted profiles last farther downstream.
Why the Distorted Velocity Profile Matters for Facility Operations
Most flow meters are calibrated assuming a symmetric, fully developed profile arriving at the sensor. That assumption falls apart near elbows, tees, valves, and other fittings.
Research shows meter error near disturbed flow can go either direction, not just over-registration.
A 1996 study on insertion paddle-wheel meters downstream of a 90-degree elbow found most configurations actually under-registered, in some cases by more than 30%, while a small number over-registered by 1-2%.
A 2016 study on ultrasonic and electromagnetic meters after double elbows found errors ranging from roughly -6% to +1% depending on distance and orientation.
In practice, there is no single universal "over-reading percentage" from elbow turbulence. Direction and size of the error depend on:
- Meter technology (mechanical, ultrasonic, electromagnetic)
- Distance from the disturbance
- Orientation relative to the bend
Addressing Meter Inaccuracy at the Source
This is exactly the problem Water Flow Innovation built its Flow Conditioning Device (FCD) to solve. Rather than targeting one specific elbow or fitting, the FCD installs immediately after the water meter and stabilizes flow using four components:
- Air and gas separation — removes entrained bubbles, producing a homogeneous water column through the measurement zone
- Pressure regulation — smooths surges from cycling equipment and variable demand
- Check valve (available on select units) — prevents reverse flow and pressure spikes that can reintroduce air
- Turbulence elimination — slows velocity enough to prevent vortex formation at the meter
Facilities using the FCD have seen 5-30% average reductions in water and sewer bills, with a highest documented result of 46%. Roughly 90% of customers reach ROI within 12 months.

These figures reflect aggregate turbulence and air-entrainment correction across many installation types, not elbow-specific testing. A site survey — including photos of nearby elbows and fittings — is part of every FCD assessment, since local pipe geometry still shapes each installation.
Pressure Loss Through 90-Degree Elbows
Pressure loss through an elbow is quantified with a loss coefficient, or K-factor, defined as K = ΔP / (0.5 × ρ × V²). Because velocity is squared in that equation, doubling flow velocity roughly quadruples the pressure loss at the fitting.
Short-radius elbows generally carry higher K-values than long-radius elbows, but exact numbers vary by manufacturer, size, and Reynolds number. For project-specific figures:
- Consult manufacturer loss coefficient tables for your exact fitting
- Reference Crane Technical Paper 410 for detailed elbow-loss data
- Cross-check K-factors against Re and geometry instead of generic web tables
Mitigating Elbow-Induced Flow Disturbance
Three approaches consistently show up across industry standards and research:
- Adequate straight pipe runs. OIML R 49-1:2024 defines upstream classes U0–U15 and downstream D0–D5 (straighteners may allow a shorter class). Manufacturer specs always override generic rules of thumb.
- Flow straighteners and conditioners. Vanes or tube bundles strip swirl and turbulence from the flow meters and other sensitive equipment see—the same principle behind meter-mounted devices like the FCD.
- Long-radius elbow specification. Specifying long-radius over short-radius or mitered elbows reduces separation severity and shortens the disturbance that follows.

Frequently Asked Questions
What is a velocity profile and what does it look like for turbulent flow?
Turbulent velocity profiles are flatter and blunter across the pipe's center compared to the parabolic shape seen in laminar flow. Steep velocity gradients are confined to a thin layer near the pipe wall.
How much water pressure do you lose with a 90 degree elbow?
Pressure loss depends on the elbow's K-factor, pipe diameter, and flow velocity, following K = ΔP / (0.5ρV²). Check manufacturer-specific loss tables or Crane Technical Paper 410 for figures matching your exact fitting.
What is the air velocity limit for laminar airflow (LAF)?
In pipe flow, the standard laminar-to-turbulent transition sits around Reynolds number 2,300. Cleanroom standards like ISO 14644 define unidirectional airflow by velocity uniformity criteria rather than a Reynolds threshold, so the two shouldn't be conflated.
How far downstream of an elbow does the flow need to travel before it's "normal" again?
Recovery length is typically measured in pipe diameters and varies with Reynolds number and bend geometry. Studies show ranges from roughly 10 diameters at higher Reynolds numbers to 70+ diameters for tight-radius bends at lower flow rates.
Can a disturbed velocity profile affect my water bill?
Yes. Disturbed flow near a meter can cause inaccurate registration, sometimes over-reading and sometimes under-reading depending on meter type. A certified flow conditioning device (FCD) corrects that turbulence and air entrainment, which can lower water and sewer bills.
Do all elbow types create the same amount of flow disturbance?
No. Short-radius and mitered elbows create more separation and turbulence than long-radius elbows, which allow a gentler, more gradual change in direction.
How is a distorted profile diagnosed from the bill alone?
A free analysis reads your water and sewer bills alongside meter size, pipe size, line pressure, and PRV configuration. Together they indicate whether the connection is registering more than it receives, without any site visit or commitment.
What cover applies once a correction is installed?
A 6-month money-back guarantee on the device purchase price, with installation cost non-refundable, so it can be returned if metered consumption does not measurably fall. A lifetime transferable warranty against manufacturing defects also applies.