One explanation that rarely gets investigated: the meter itself may not be reading accurately. Water meter inaccuracy is more common than most facility operators realize, and unlike a leak, it produces no alarm, no visible symptom, and no automatic correction. It simply inflates the bill, month after month.
This article covers what water flow meter accuracy actually means, how it's expressed on spec sheets, what causes meters to drift from accurate readings, and what commercial facilities can do to verify — and protect — measurement accuracy over time.
Key Takeaways
- Water meter accuracy is expressed as ±% — and whether that percentage is based on full scale or actual reading changes everything
- No meter achieves perfect accuracy — all carry inherent error margins that can grow over time
- Air entrainment and turbulent flow cause meters to over-read, inflating both water and sewer charges simultaneously
- Over-reading produces no alarm; it compounds silently across every billing cycle
- Flow conditioning at the meter typically resolves over-reading at lower cost than replacing the meter
What Is Water Flow Meter Accuracy?
Water flow meter accuracy is the measure of how closely a meter's reported reading matches the actual volume of water moving through the pipe. It's typically expressed as a ±percentage — so ±2% means the meter's displayed reading may be up to 2% above or below the true flow.
No meter achieves perfect accuracy. Every meter carries an inherent margin of error, and that margin can widen over time or under poor flow conditions.
Accuracy vs. Repeatability
These two terms are often confused, and the difference has direct billing consequences.
Accuracy is closeness to the true value. Repeatability is how consistently a meter produces the same reading under the same conditions, whether or not that reading is correct.
A meter can be highly repeatable while being consistently wrong. If a meter reads 5% high every single day, every reading is repeatable and every bill is overstated.
For commercial facilities, trend-based monitoring won't catch this because the baseline number itself is wrong. Every downstream decision built on that data, from scheduling and budgeting to ESG reporting, inherits the error.
Accuracy vs. Resolution
Resolution is the smallest increment a meter can detect or display. Even an accurate meter creates problems if its resolution is too coarse for the flow ranges being monitored. A meter that only reads to the nearest gallon may round up consistently during low-flow periods — a small error per reading that compounds across billing cycles.
How Water Meter Accuracy Is Expressed on Spec Sheets
Accuracy specs are not always comparable across meters. The same headline number can represent very different real-world performance depending on how it's calculated. The two most common methods are Percentage of Full Scale (% FS) and Percentage of Reading (% RD).
Selecting a meter based on a headline spec number without understanding the calculation basis is a common and expensive mistake.
% of Full Scale vs. % of Reading
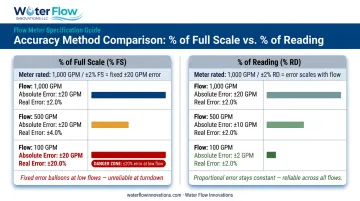
% of Full Scale calculates the error margin against the meter's maximum rated capacity. That absolute error stays constant across the entire flow range.
A practical example: a meter rated at ±2% FS with a 1,000 GPM capacity carries an absolute error of ±20 GPM at every flow rate. At 100 GPM, that's not ±2% — it's ±20% of the actual reading, according to the % of Reading vs. % of Full Scale analysis from AMETEK Calibration. The headline spec dramatically understates the real error at low flows.
% of Reading calculates error as a fixed percentage of whatever flow is actually being measured. At 100 GPM with a ±2% RD spec, the error is ±2 GPM — not ±20 GPM. This format scales proportionally, making it generally more favorable for facilities whose water demand fluctuates throughout the day or season.
Accuracy Class and Rating Standards
Beyond % FS and % RD, some meter types use accuracy "classes" that group meters into defined error tolerance bands. OIML R49 defines two classes for water meters:
| OIML Class | Lower zone (Q1 to Q2) | Upper zone (Q2 to Q4) |
|---|---|---|
| Class 1 | ±3% | ±1% |
| Class 2 | ±5% | ±2% |
OIML also notes that in-service permissible errors should be double the initial-verification values. That means an in-service Class 2 meter may legally read within ±10% at low flows — well beyond what the class label suggests at first glance.
AWWA standards (C700, C701, C702, C704) cover specific meter types for cold-water customer service applications. Facility managers should confirm which standard applies to their installed meter and what the class actually permits at their typical operating flow range.
What Causes Water Meters to Read Inaccurately?
Meter inaccuracy is rarely just a hardware defect. It's a system outcome shaped by the fluid conditions entering the meter, the pipe environment, and the meter's maintenance history. Understanding these causes helps facility managers identify whether their meter is likely over- or under-reading.
Air Entrainment and Turbulent Flow
Air entrainment occurs when air bubbles or dissolved gases enter the water supply line and travel through the meter. The meter counts air as water volume, because from its perspective, something occupied space in the pipe. The result is a registered flow rate higher than the actual liquid volume passing through, causing the meter to over-read.
This is particularly common in systems with fluctuating pressure, pump cycling, or aging infrastructure.
Turbulent flow compounds the problem. Meters are calibrated under controlled, stable flow conditions. When turbulence is present — caused by pumps, pressure fluctuations, or rapid velocity changes — the erratic movement of water through the measurement zone disrupts accurate reading. Turbulence can push errors high enough to noticeably affect billing.
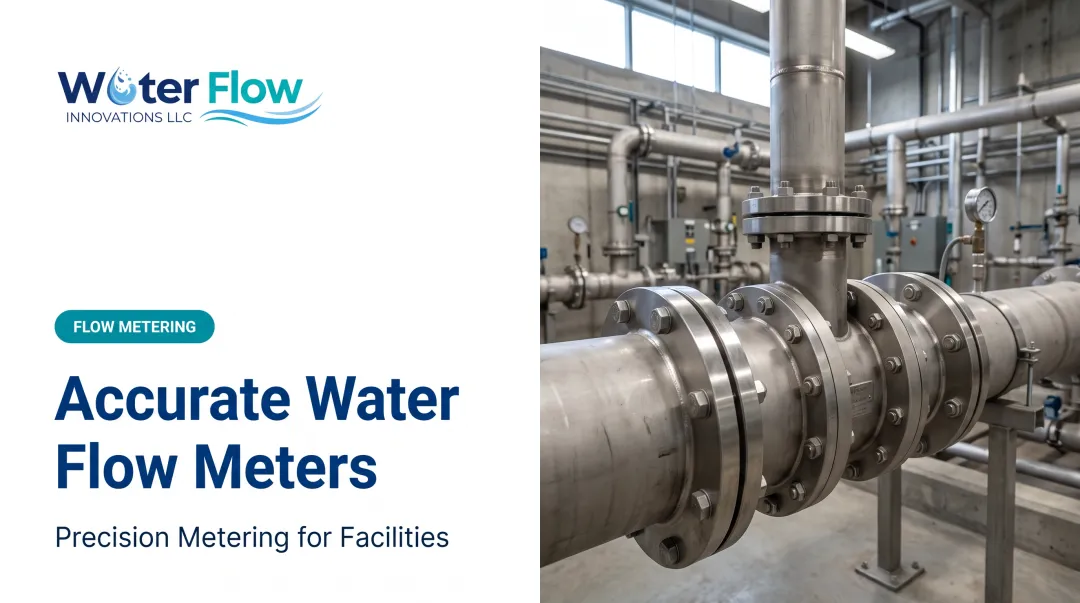
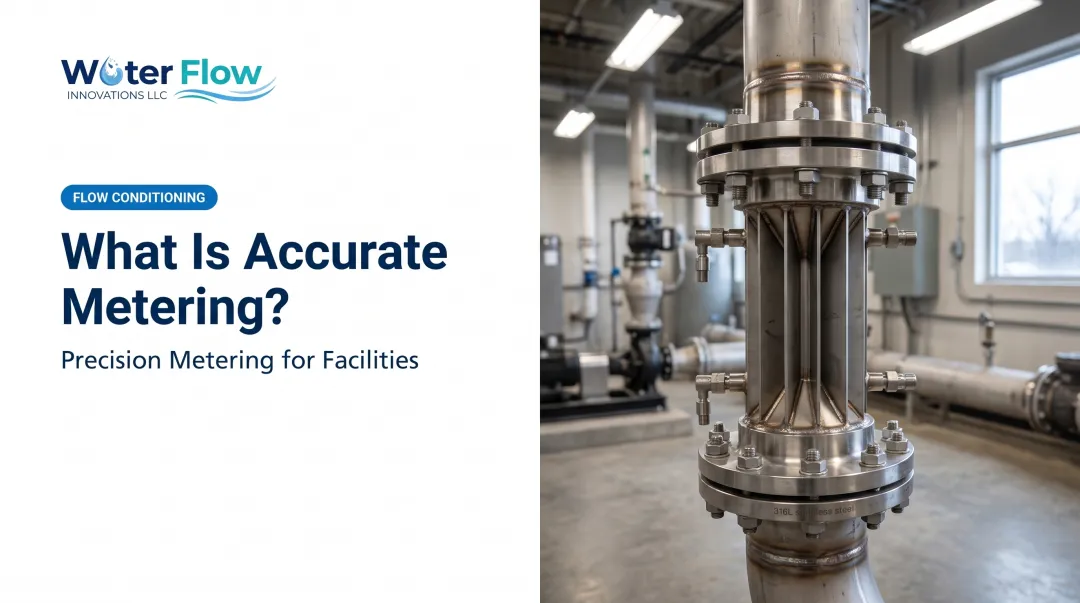
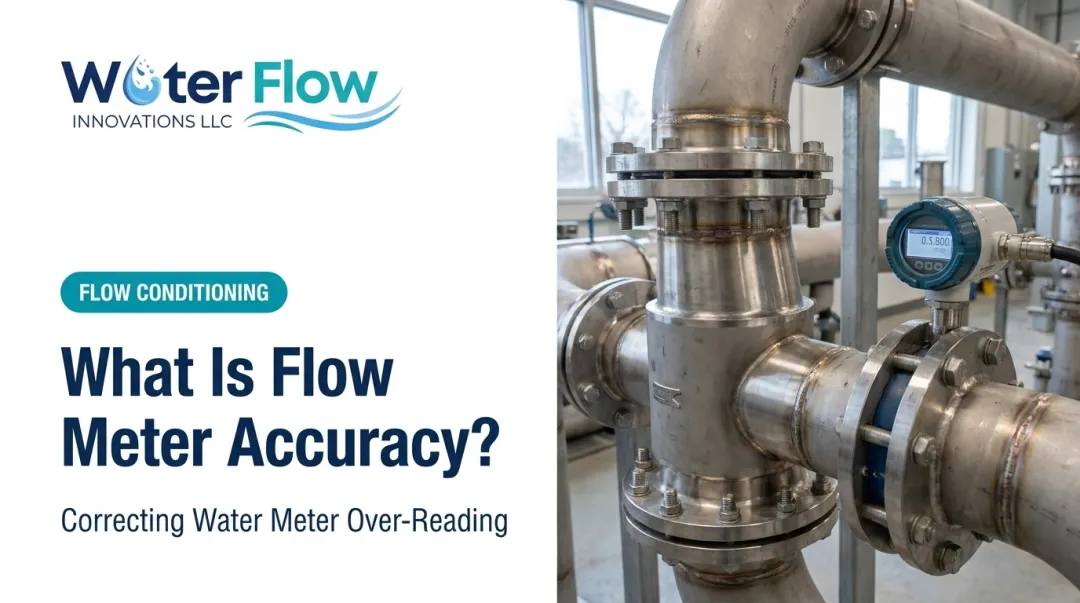
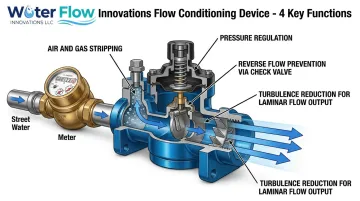
Water Flow Innovation's Flow Conditioning Device (FCD) is engineered specifically to address both conditions. Its 4-component system works simultaneously to stabilize flow at the meter:
- Strips entrained air and dissolved gas, delivering a 100% homogeneous water column
- Regulates pressure at the meter entry point, dampening surges from on-off pump cycling
- Blocks reverse flow through an integrated check valve, reducing water hammer events
- Reduces turbulent vortex flow to produce stable, laminar flow through the measurement zone
Installation is usually about an hour (+/-) with negligible pressure loss downstream.
Flow Disturbances from Pipe Configuration
Pipe fittings — elbows, tees, reducers, partially open valves — create uneven velocity profiles and swirl in water moving toward the meter. The meter receives distorted flow rather than the uniform, developed profile it was calibrated for. Depending on meter technology, this introduces errors in either direction.
As a general reference, PNNL's Water Metering Best Practices guidance recommends a minimum of 10 pipe diameters of straight run upstream and 5 downstream for turbine meters, though this varies by meter type and manufacturer. Emerson's magnetic meter guidance specifies 5 diameters upstream and 2 downstream. Always use the requirement from the specific meter's manual — not a universal rule.
Meter Age, Wear, and Calibration Drift
All meters degrade over time:
- Mechanical meters experience wear on moving parts, reducing accuracy and reliability
- Electromagnetic meters can suffer electrode coating or corrosion from scale or mineral deposits
- Ultrasonic meters can lose signal quality when pipe walls develop buildup
This drift is gradual and rarely triggers an obvious failure. The meter simply moves away from its original calibration curve without triggering any alarm.
Warning signs to watch for:
- Unexplained increases in water consumption without operational changes
- Pump runtime that no longer aligns with metered volume
- Water and sewer bill totals that diverge from historical norms
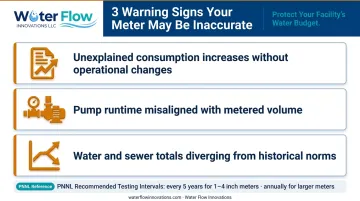
PNNL recommends testing 1- to 4-inch meters every 5 years and meters larger than 4 inches annually.
Why Over-Reading Matters More Than Under-Reading
There's a meaningful asymmetry here. If a meter under-reads, the facility receives an artificially low bill — which the utility may eventually correct through a re-read or audit. If a meter over-reads, the facility pays for water it never used, and there is no automatic correction mechanism. The overcharge accumulates unchecked until someone actively investigates.
The sewer bill compounds the problem. As the EPA's metering and submetering guidance confirms, sewer usage is typically not separately metered at the facility level — most utilities estimate sewer charges from metered water consumption. An over-reading meter therefore inflates both the water charge and the sewer discharge fee simultaneously. For large commercial or industrial consumers, this double-billing effect can run thousands of dollars per billing cycle — two separate line items inflated by the same root cause.
For facilities pursuing sustainability goals, the impact extends further. LEED requires permanent water meters and, for applicable credits, five years of whole-project water-use data. An over-reading meter corrupts that baseline from the start. Specifically, inflated data undermines:
- Conservation progress tracking against established targets
- ESG water intensity metrics used in sustainability reporting
- Efficiency improvement benchmarks tied to the original baseline
Every calculation built on a false starting number produces a false result.
How to Verify and Improve Your Water Meter's Accuracy
Field Verification Methods
Two approaches are commonly used:
- Comparison to a calibrated reference — either a certified portable meter installed in series or a traceable tank fill test, testing the meter at low, medium, and high flow rates
- Third-party calibration service — a laboratory or field calibration with documented traceability, as-found results, and as-left results
For billing-grade meters, any verification results should be documented in writing to support utility disputes or ESG reporting.
Installation and Maintenance Steps
- Ensure adequate straight-pipe runs upstream and downstream per the meter manufacturer's specifications
- Verify the meter is not installed at a high point in the pipe where air can accumulate — Endress+Hauser specifically recommends ascending pipe installations to keep the measuring tube full
- Keep the pipe full during operation
- Follow manufacturer-recommended inspection and cleaning intervals, particularly in hard-water or mineral-heavy supply conditions
When to Address the Root Cause
If verification confirms that a facility has air entrainment, pressure fluctuations, or turbulent flow upstream of the meter, recalibration alone will not permanently resolve the problem. The meter will drift again as soon as it's reinstalled into the same flow conditions.
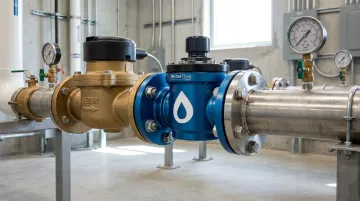
Addressing the upstream flow conditions (rather than replacing the meter) is often the more cost-effective path. Water Flow Innovation's Flow Conditioning Device installs at the meter's flange and corrects air entrainment and turbulence without an operational shutdown. Key installation and financial details:
- Compatible with any meter type and pipe sizes from ½" to 12" NPS
- Installation is usually about an hour (+/-)
- 90% of customers achieve full ROI in under 12 months
- Savings appear on the first billing cycle after installation
Frequently Asked Questions
How accurate are water flow meters?
Accuracy varies significantly by technology and flow zone. High-performance electromagnetic meters can achieve ±0.25% of rate; OIML Class 2 meters permit ±5% in the lower flow zone. Real-world performance is often worse due to air entrainment, turbulent flow, poor installation, or meter wear.
What does ±2% accuracy mean on a water meter?
It means the reported reading may be up to 2% above or below actual flow, but the spec basis matters as much as the number. A ±2% of Reading spec scales with actual flow; a ±2% of Full Scale spec holds the absolute error fixed, so at low flows the real percentage error can be far larger than 2%.
Can a water meter over-read and cause higher bills?
Yes. Meters regularly over-read due to air entrainment and turbulent flow conditions. Because sewer fees are typically calculated from metered water consumption, an over-reading meter inflates both the water charge and the sewer discharge fee simultaneously, and utilities provide no automatic correction.
What causes a water meter to lose accuracy over time?
Common causes include:
- Mechanical wear on moving parts
- Scale or mineral buildup on electrodes or pipe walls
- Calibration drift in aging sensors
- Persistent air entrainment or turbulence the meter wasn't designed to handle continuously
What is the difference between flow meter accuracy and repeatability?
Accuracy measures how close a reading is to the true value; repeatability measures how consistently the meter produces the same reading under the same conditions. A meter can be highly repeatable while being wrong every time, so repeatability alone does not protect a facility from overbilling.
How do I know if my meter is over-reading?
Watch for unexplained increases in consumption without operational changes, pump runtimes that don't match metered volume, or water and sewer totals that diverge from historical patterns. A free bill review from Water Flow Innovation can identify over-reading patterns based on your actual utility billing data before any purchase decision is made.
How long does it take to correct persistent air entrainment?
About one hour of installation, with water off for that hour only. The device is fitted on the main line after the meter by a licensed plumber or mechanical contractor, and negligible pressure loss means downstream equipment performs exactly as before.
What guarantee applies if accuracy doesn't improve?
A 6-month money-back guarantee covers the device purchase price, with installation cost non-refundable, so it can be returned if metered consumption does not measurably fall. A lifetime transferable warranty against manufacturing defects also applies and follows the property on sale.