
Many facility managers only notice pressure when something breaks. That's a costly way to learn. Understanding the operating range, what drives fluctuation, and where the boundary limits sit lets you catch problems before they become expensive ones.
This article breaks down what pressure variation actually means, the psi ranges that govern safe operation, the factors that push systems out of range, and what to do about it.
Key Takeaways
- Pressure variation is dynamic, shaped by demand cycles, elevation, and aging infrastructure rather than a fixed number
- Minimum pressure thresholds vary by state: California requires 20 psi, Texas requires 35 psi
- High and low pressure extremes both carry real risk, from pipe bursts to backflow contamination
- Sensors and SCADA catch pressure deviations early, before they turn into failures
- Flow conditioning technology can stabilize turbulence-driven pressure irregularities without changing system output
What Pressure Variation Represents in a Water Distribution System
Pressure variation is the fluctuation of force that water exerts against pipe walls, measured in psi, across time and location. It is a derived operating condition shaped continuously by demand, elevation, and equipment behavior, not a fixed design constant.
Technically, pressure at any point in a network is the local hydraulic head that remains once elevation and friction losses are subtracted. Pumps add head. Elevation changes and pipe friction consume it. EPA's EPANET 2.2 modeling framework treats pressure this way: as a function of time-varying demand and system controls, not a static value.
That's why pressure works as both an input and a constraint in any distribution network:
- Input: Pumps and elevated storage tanks supply the energy that generates pressure
- Constraint: Pipe material ratings, fittings, and valve specifications cap how much pressure the system can safely carry
When demand rises, velocity and friction loss rise with it, leaving less pressure at remote or elevated points in the network. A single pump-speed adjustment or tank-level change can shift pressure at dozens of downstream locations simultaneously.
Factors That Influence Pressure Variation in Real-World Operation
Modeled pressure and field-measured pressure rarely match perfectly. The gap comes from several compounding factors:
- Elevation changes: High points set a zone's low-pressure boundary; low points set the high-static boundary. Booster stations and pressure zones manage this split.
- Diurnal and seasonal demand: Morning and evening peaks, plus irrigation-season spikes, create daily and monthly swings a single gauge reading won't capture.
- Aging infrastructure: Pipe degradation and undetected leaks drive long-term pressure instability. A 2019 peer-reviewed review found higher rates of main breaks and pressure loss in deteriorating systems.
- Installation and manufacturing tolerances: Valves and regulators drift out of calibration over time, creating measurement error that looks like real variation but isn't.
The practical takeaway: don't calibrate a model against a single gauge reading. Verify sensor calibration and equipment status first, then adjust for demand and pipe roughness.
Range of Pressure in Water Distribution Systems
There's no single national "normal" psi. Acceptable pressure depends on regulatory rules, infrastructure design limits, and building height in the service area.
Nominal Operating Range
Minimum pressure requirements vary meaningfully by state:
| Jurisdiction | Minimum Requirement | Context |
|---|---|---|
| California | 20 psi at service-line connection | Applies at all times, per Cal. Code Regs. Tit. 22, § 64602 |
| California (new expansion) | 40 psi, excluding fire flow | For expansions affecting over 20% of connections |
| Texas | 35 psi under normal operation | Per Texas Administrative Code § 290.46 |

These figures assume stable demand and functioning pressure-reducing valves (PRVs). Once a PRV starts drifting or fails, actual pressure can diverge sharply from the design range.
Allowable Tolerance and Boundary Limits
On the upper end, the 2021 International Plumbing Code sets 80 psi static pressure as the threshold requiring a pressure-reducing valve inside buildings. That figure is a building-code boundary, not a municipal main maximum. Above it, appliance damage, accelerated fitting wear, and water hammer risk climb sharply.
On the lower end, falling below the state-mandated minimum creates two problems:
- Inadequate supply to upper floors, fire suppression, and process equipment
- Backflow contamination risk, since negative or near-zero pressure can pull contaminants into the potable system through cross-connections
Two very different pressure problems get mixed up in the field:
- Short-term transients: surges and water hammer lasting seconds that can exceed a pipe's structural strength even when routine gauge readings look fine
- Sustained out-of-range operation: chronic high or low pressure that drives gradual wear, compliance violations, and rising water loss
Safe Operating Margin
Utilities design in margin below the maximum design pressure and above the minimum service threshold, rather than running systems right at the edge. Operating consistently near either boundary accelerates wear on gaskets, joints, and valves, and increases the odds of a compliance violation when demand spikes unexpectedly.

Key Technical Properties of Pressure Variation
Beyond the numeric range, three technical properties define how pressure behaves day to day.
Stability and Repeatability
Pressure shifts under load spikes, time-of-day demand, and pump cycling. A reading taken at 2 a.m. during low demand tells you almost nothing about peak-hour conditions. Repeatable readings, taken under comparable conditions, matter more for diagnostics than any single data point.
Interaction with Flow and Turbulence
Turbulent flow, air entrainment, and sudden velocity changes distort pressure readings, and they can distort metering accuracy too. Local turbulence and velocity profile disruptions near elbows, valves, or inadequate straight-pipe runs are documented to affect flowmeter accuracy in a 2019 AWWA Water Science study.
There's also a real trade-off at play: pushing pressure higher improves flow delivery but adds mechanical stress to pipes, joints, and connected equipment. More pressure isn't automatically better.
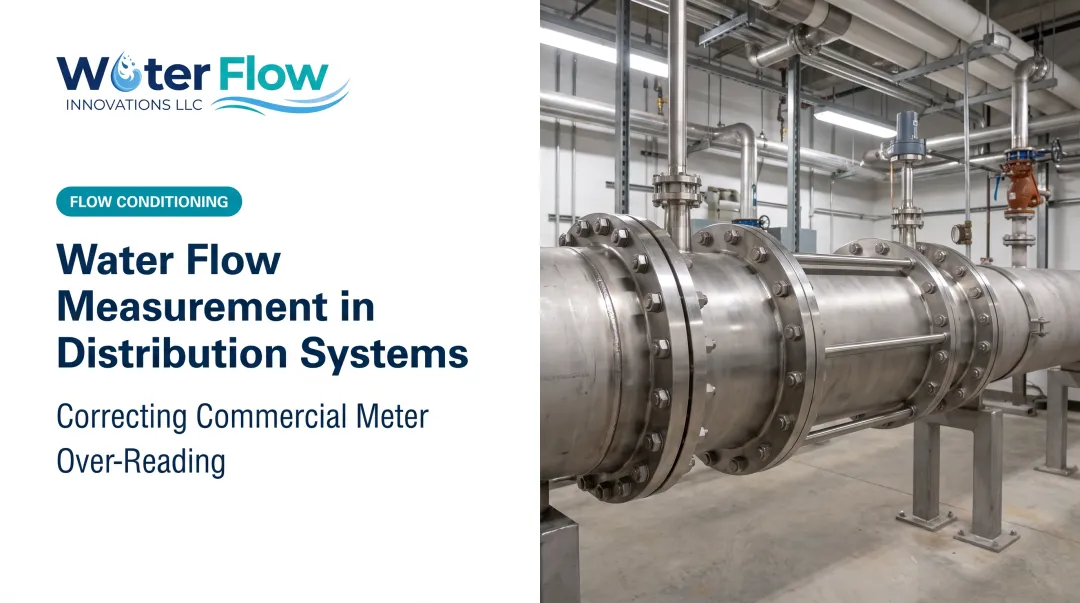
That same air entrainment and vortex-style flow near a meter can cause it to register volume that was never delivered. Water Flow Innovation's Flow Conditioning Device targets this mechanism directly.
The device uses static back-pressure to strip air out in the meter's measurement zone, creating a homogeneous water column. Pressure loss stays negligible—0 psi in most cases, with a documented 3–5 psi reduction only under high-volume open-discharge conditions.

Zone-to-Zone Variability
Pressure differs meaningfully across zones due to elevation change and distance from the source. A reading from one zone can't be assumed to represent another. Facilities spanning multiple zones or floors — high-rise multifamily buildings, campuses, large industrial sites — need localized monitoring, not system-wide assumptions.
Measuring, Monitoring, and Managing Pressure Variation
Pressure monitoring serves two purposes at once: regulatory compliance and early-warning diagnostics.
Common instruments include:
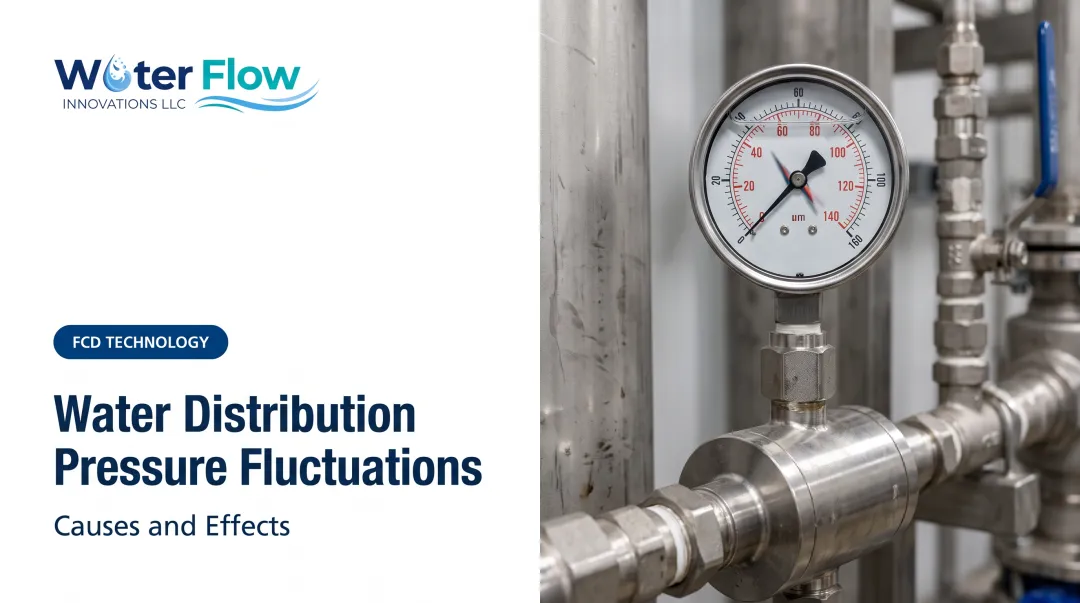
- Pressure sensors and transducers at high/low elevation points and critical junctions
- Data loggers for trend capture and transient detection; some sample as fast as 20 times per second, according to the National Academies' review of distribution system monitoring
- Remote telemetry for real-time field readings without manual site visits
SCADA systems aggregate this sensor data, trigger threshold alarms, and in many setups allow remote valve adjustments to correct deviations before they escalate. SCADA is the integration layer, not the sensor itself: it compiles data from across a network for operational decision-making.

Lab-rated or theoretical pressure values rarely match real field measurements. Turbulence, installation variables, and calibration drift all introduce gaps between the model and the meter.
Ignoring pressure irregularities carries compounding costs:
- Accelerated wear on pipes, joints, and connected equipment
- Safety and regulatory compliance violations
- Water loss through undetected leaks
- Customer or tenant complaints tied to inconsistent supply
Those costs make trustworthy field data non-negotiable. Facilities that see turbulence-driven readings from CIP cycles, tank filling, cooling tower makeup, or irrigation zone cycling need a stable flow profile at the meter.
A flow conditioning device (FCD) stabilizes that profile without restricting throughput or requiring changes to downstream equipment. Installation typically takes about an hour, with normal operations resuming immediately.
Conclusion
Pressure variation actively governs how a distribution system performs. Knowing its operating range, the factors that push it out of bounds, and the early warning signs is what keeps systems reliable instead of prone to costly failure.
Consistent monitoring paired with corrective technologies gives utilities and facility operators the strongest defense against pressure-related failures — burst pipes, compliance violations, or water bills inflated when turbulence makes the meter over-read real flow.
Frequently Asked Questions
Why is my water pressure fluctuating so much?
Fluctuations typically come from demand cycling, elevation differences, pump operation, or aging and faulty pressure-reducing valves. Daily peaks (morning, evening) and seasonal spikes (irrigation season) are common culprits too.
What is the minimum pressure required for a water distribution system?
No single national minimum exists; requirements vary by state. California requires at least 20 psi at the service connection, while Texas requires 35 psi under normal operation. Falling below risks inadequate supply and backflow contamination.
What are the four types of water distribution systems?
The four common layouts are tree/branch (single-path dead-end mains), loop/ring (closed mains with multiple supply paths), grid (densely interconnected loops), and radial (zones fed from a central source). Each affects pressure consistency differently.
How often should water pressure be monitored in a distribution system?
Continuous or near-real-time monitoring via SCADA and sensors is now standard practice, especially in aging or critical zones. Fast transients like water hammer can last only seconds, so periodic manual checks miss too much.
What happens if water pressure is too high for too long?
Sustained high pressure accelerates pipe and fitting wear, increases equipment damage risk, contributes to water hammer, and drives up water loss through leaks that worsen under pressure.
Can equipment help stabilize inconsistent pressure readings?
Yes. Flow conditioning devices reduce turbulence and air entrainment that distort pressure and meter readings, improving accuracy without restricting flow or changing system output.
Does pressure-driven distortion reach the wastewater charge as well?
Usually. Utilities generally derive sewer from metered intake rather than measuring discharge, commonly at 80–120% of the water charge, so distortion at the meter inflates both lines of the same bill.
How much disruption does adding conditioning cause?
About an hour, with a brief water shutoff at the meter connection, fitted at the service connection by a licensed plumber or mechanical contractor. Monitoring, SCADA, and existing PRVs continue operating as configured.