
Flow stabilization isn't a plumbing footnote. It touches metering accuracy, energy consumption, and your bottom line all at once. This guide breaks down what causes flow instability, the core strategies facilities use to fix it, and how to capture measurable efficiency gains without shutting down operations.
Key Takeaways
- Turbulence and air entrainment distort water meters, often causing over-registration and inflated bills
- Pressure management, hydraulic modeling, and flow conditioning are the three main levers for stabilization
- Facilities with aging meters or infrastructure face the highest risk, and the biggest savings opportunity
- Correcting meter over-registration can deliver verifiable savings starting on the very next billing cycle
What Causes Water Distribution Flow Instability
Turbulence and Velocity Disruption
Pipe bends, valves, and improperly sized piping all disrupt smooth flow. The Pacific Northwest National Laboratory notes that fittings and valves near a meter are common turbulence sources.
Turbine or compound meters need at least five pipe diameters of straight run upstream and downstream to measure accurately (PNNL). Oversized meters make it worse—they struggle to register accurately at low flow.
Air Entrainment
Air pockets entering through pumps, valves, or intake points create pressure fluctuations and metering errors. When air flows through meters during intermittent supply, it drives over-registration and reliability problems.
Pressure Transients (Water Hammer)
Sudden valve closures or pump cycling create surges that can damage infrastructure over time. Air valves placed near a water meter can increase overpressure under certain conditions. Larger valves may also weaken the cushioning effect that normally absorbs shock.
Hydraulic Design Flaws
Dead-end mains, oversized pipes, and poor network looping create inconsistent flow and water age issues. These design flaws often go unnoticed until a facility investigates unexplained billing spikes or pressure complaints.
Instability has multiple root causes. Diagnosing the right one takes pressure logging and meter diagnostics, not a hunch based on a high bill.

Core Strategies for Stabilizing Flow and Improving Efficiency
Fixing flow instability usually requires layering several strategies rather than relying on one fix.
Pressure management. Installing pressure-reducing valves (PRVs) and variable speed pumps keeps pressure consistent and minimizes transients. Code guidance from IAPMO requires a regulator whenever static supply pressure exceeds 80 psi.
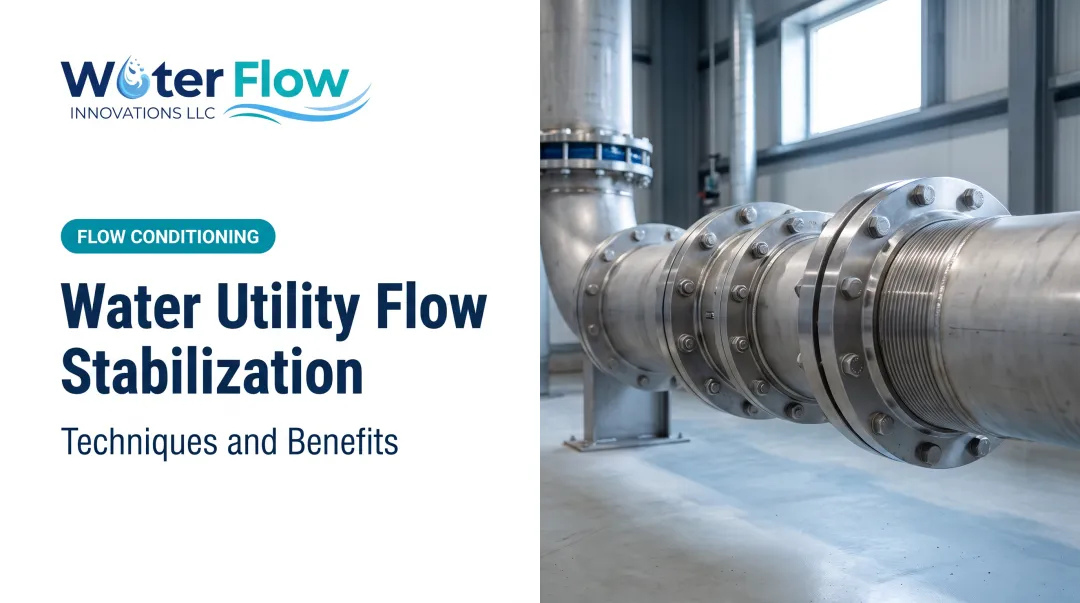
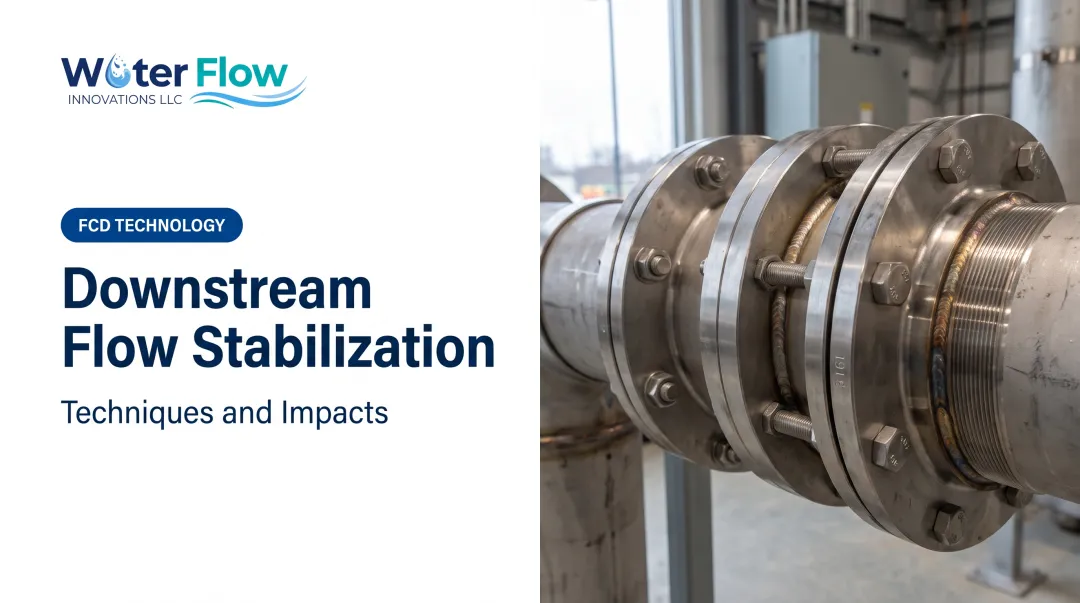
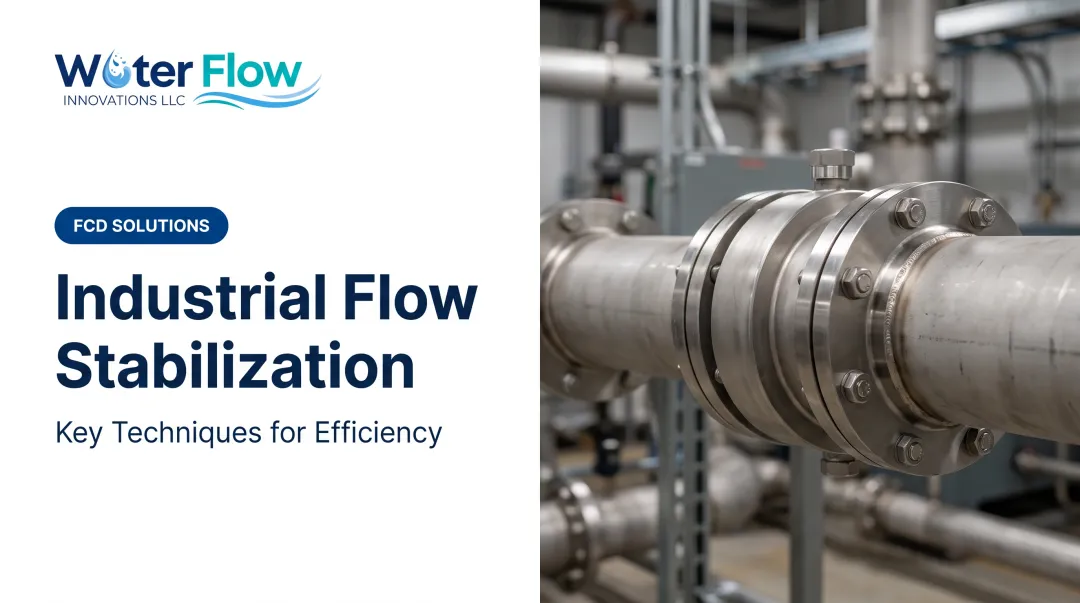
Flow conditioning technology. Devices installed at the point of use correct hydraulic inefficiencies directly. Water Flow Innovation's Flow Conditioning Device (FCD) is one example of a certified system combining four functions in a single unit:
- Air/gas separation – creates a homogeneous water column so the meter measures water, not a water-air mixture
- Pressure regulation – reduces water hammer from on-off cycling
- Check valve function (on select models) – minimizes reverse flow and pressure spikes
- Turbulence elimination – slows velocity enough to prevent vortex flow during CIP cycles, tank filling, or open discharge
The FCD installs immediately after the meter with negligible pressure loss, so it does not affect downstream equipment performance.

Those point-of-use corrections work best alongside sound network design and operations.
Proper pipe sizing and network design. Right-sizing mains and service lines, and favoring looped over branch configurations, helps maintain steady flow. Looped systems offer multiple flow paths and better resilience; branched systems cost less but carry more risk of dead-ends and stagnation.
Support those design choices with modeling, maintenance, and monitoring:
- Hydraulic modeling: EPA's EPANET models pipe flow, pressure, pumps, valves, and time-varying demand so facilities can test scenarios before changing physical infrastructure
- Routine maintenance: AWWA's M44 guidance on valve selection, condition testing, and exercise frequency helps prevent deposits from disrupting flow
- Smart monitoring: SCADA systems and real-time pressure sensors catch instability before it becomes a costly problem
The Efficiency and Cost Impact of Flow Stabilization
Here's the part that gets facility managers' attention: flow instability wastes energy and distorts what you're billed for.
When turbulence or air entrainment causes a meter to over-register, you're paying for water you never actually used. Correcting that over-registration directly reduces both water consumption charges and sewer discharge fees, since sewer billing is typically calculated from metered water use.
Documented results from certified flow conditioning:
- Average bill reductions of 5-30%
- 46% savings in top documented cases
- 90% of customers achieve full ROI in under 12 months
- Savings typically appear on the very next billing cycle

This matters because facilities can't always afford downtime for infrastructure upgrades. Unlike pipe replacement or network redesign, flow conditioning doesn't require production stoppages, tenant disruption, or long ramp-up periods. The meter reads accurately from the moment of installation.
One caveat: some utilities read meters only every 2-3 months or use estimated billing. In those cases, the first statement after installation may not show the full reduction, but the correction is happening regardless of when it appears on paper.
Billing accuracy is only half the efficiency story. The EPA reports that municipal water and wastewater plants can save 15-30% through practices like pump optimization. That figure is utility-level data, not a facility guarantee, but it shows why steadier pressure and cleaner flow conditions carry energy value alongside lower bills.
Best Practices for Implementation
Getting flow stabilization right starts before any equipment goes in the ground.
Assess before you act. A system-specific hydraulic assessment should cover pipe material, age, demand patterns, and pressure zones. Skipping this step risks fixing the wrong problem.
Prioritize low-disruption solutions. Look for:
- Certifications like IAPMO, NSF, ANSI, and KIWA that validate performance and safety
- Fast install: an FCD typically takes about one hour, with a brief water shutoff and no changes to production equipment or tenant areas
- Flexible payment structures (purchase or lease) that reduce upfront capital risk
Document everything. Keep actual utility bills that show metered consumption before and after install. That auditable proof supports ESG reporting, LEED, and sustainability programs—without extra metering infrastructure.
Industries and Facilities That Benefit Most
High water-use sectors feel flow instability the hardest, since even small inefficiencies compound across large volumes.
- Industrial manufacturing – chemical, automotive, and pulp & paper plants with high-volume, variable-demand processes
- Food & beverage – accounts for roughly 15% of U.S. commercial and industrial water use
- Healthcare – hospitals and medical centers where continuity matters as much as cost, representing about 7% of C&I use
- Hospitality – hotels and resorts, another 15% of C&I water use, with wide swings between peak occupancy and low season
- Multifamily housing – high-rise and apartment buildings with shared metering infrastructure
- Data centers – continuous cooling-water demand with little tolerance for downtime

Facilities with aging infrastructure or older meters are especially prone to over-reading. Smaller R&D and pilot semiconductor fabrication sites, for example, often run older metering equipment that produces higher-than-average over-reading rates. That makes them strong candidates for flow conditioning.
Frequently Asked Questions
What are the main components of a water distribution system?
Core components include transmission and distribution pipes, service lines, pumps, valves, storage tanks or reservoirs, meters, and control and monitoring systems.
How does flow instability affect water meter accuracy?
Turbulence and air entrainment can cause meters to over-register flow, meaning you're billed for more water than you actually consumed. This happens because meters are calibrated to measure a smooth water column, not a mix of water and air.
What is the difference between a grid/looped and branched distribution system?
Looped systems provide multiple flow pathways, offering better pressure stability and redundancy during maintenance or breaks. Branched systems are simpler and cheaper to build but more prone to dead-ends and water stagnation.
How quickly can facilities see results from flow stabilization measures?
Flow conditioning can show billing changes on the next cycle after installation. The meter reads accurately right away, unlike infrastructure upgrades that can take months to affect costs.
Does flow conditioning affect water pressure or system performance?
Flow conditioning devices are built for negligible pressure loss. Downstream equipment sees essentially the same pressure as before, so operations and system performance stay intact.
What industries benefit most from water flow stabilization solutions?
High-volume users—manufacturing, hospitality, healthcare, and multifamily buildings—see the biggest impact because meter error and unstable flow add up quickly on water and sewer bills.
How large is the correction on a distribution-fed connection?
Documented installations average a 5–30% reduction in combined water and sewer charges, with a highest documented single result of 46%, applied from the first billing cycle after installation.
Can an operator apply this across many service connections?
Yes. Each connection with its own metered municipal supply is a separate installation opportunity, so savings compound and the before-and-after billing evidence aggregates for benchmarking and capital planning.