
Households feel this at the kitchen sink. Businesses feel it multiplied. A hotel, hospital, or manufacturing plant runs thousands of gallons through its meter daily, so every rate hike and every measurement error gets scaled up dramatically.
This guide breaks down national and state-level averages, why bills keep rising, how much water you should actually be using, and proven ways to cut costs, without cutting operations.
Key Takeaways
- National median water/sewer bill: $89/month ($1,065/year), up 2.8% year over year
- Maryland tops the list at $245/month; Wisconsin is among the lowest in verified state data at $145/month
- Usage volume and occupancy drive most costs—meter over-reading is a hidden multiplier
- Facilities can cut bills 5–46% with flow conditioning, without using less water
What Is the Average Water and Sewer Bill in 2026?
The current national median sits at $89/month, or $1,065 annually, based on real bill-payment data from doxoINSIGHTS. That's up from $87/month in February 2026 and $86/month in late 2025. 72% of US households pay this bill.
A separate usage-standardized figure from the American Water Works Association puts the average at $95.02/month for 6,200 gallons of use, up from $79.39/month in 2017.
Why the Range Varies So Widely
Bill amounts swing based on:
- Rate structure — uniform (same price per gallon), tiered (price rises with volume), or seasonal (higher in irrigation months)
- Local infrastructure age — older systems push more capital costs into rates
- Sewer calculation method — most utilities bill sewer from metered water use, not actual wastewater volume
If your water reading goes up, your sewer bill compounds it. A 10% water increase can trigger a 10% sewer increase on top, even though your actual wastewater output hasn't changed.
Average Water and Sewer Costs by State
Combined water and sewer bills vary widely by state—and city-level rates can diverge even further from the statewide picture. Treat multi-state averages as planning context, not your facility's invoice.
| State | Monthly average (approx.) | Reporting context |
|---|---|---|
| Maryland | $245 | Among the higher published state-level figures in recent bill-pay datasets |
| North Carolina | $223 | High end in the same comparative sets |
| Wisconsin | $145 | Mid-range in recent published comparisons |
| Pennsylvania | $79 | Lower in statewide averages; local rates often run higher |

Figures above are illustrative monthly averages from recent public bill-pay comparisons. Periods and methods differ by source, so don’t merge them into a single official ranking.
Why the spread is so wide
State averages move for structural reasons, not just climate or “cost of living”:
- Aging distribution and collection systems that need replacement
- Treatment standards and consent-decree driven capital projects
- Combined sewer systems and wet-weather handling costs
- Rate design (flat fees vs. volume tiers) and how sewer is pegged to water use
- Local utility governance—municipal, authority, or investor-owned
Pennsylvania: low average, sharp local spikes
Pennsylvania often lands near the lower end of published statewide averages (around $79/month in recent comparisons). Local rate cases tell a different story. In Scranton and Dunmore, sewer charges rose from $55.75 to $95.01/month after a December 2022 settlement—a 70.4% jump for affected customers.
For multi-site operators, that gap is the point: budget off the tariff where each building sits, not the state mean.
North Carolina: higher than many expect
North Carolina shows up near $223/month in recent comparative sets—toward the high end nationally. That undercuts the assumption that Southeast markets are uniformly cheap on water and sewer. Fast-growing service areas and system investment both show up in the bill.
Other states watch-list (limited statewide medians)
Clean, comparable statewide combined medians are still thin for several large markets. Directionally:
- New Jersey — Typically a higher-cost Northeast market; aging infrastructure and dense municipal systems keep pressure on rates
- Michigan — Statewide median hard to pin in the same datasets; utilities have carried heavy infrastructure replacement costs
- Florida — Population growth continues to lift demand and capital needs across municipal systems
How to use state averages
Use state figures to size relative exposure when comparing sites. Then pull the actual water and sewer tariff, fixed service charges, and sewer-return assumptions for each facility. Two buildings in the same state can post very different bills if one sits in a high-rate municipality or on a meter that over-reads turbulent flow—the line items state averages never show.
Why Are Water and Sewer Bills Rising in 2026?
Several forces are converging to push rates upward, and most aren't going away anytime soon.
Aging infrastructure tops the list. The EPA estimates $625 billion is needed over 20 years for drinking-water infrastructure, plus at least $630 billion for wastewater systems. Scranton and Dunmore's $6.7 million sewer project replaced pipes nearly a century old. Pennsylvania American Water's 2026 rate increases are funding a $1.2 billion capital improvement plan.
Data centers are adding pressure. US data centers directly consumed 17 billion gallons for cooling in 2023, with indirect electricity-related water use reaching 211 billion gallons. Columbus, Ohio saw water rates rise 18% and sewer rates rise 8%. The metro area is expanding capacity partly to support more than 130 data centers.
Meter over-reading is an overlooked factor. Turbulent flow, air entrainment, and disturbed velocity profiles can affect meter accuracy — a documented issue in AWWA flowmeter research. Usage can stay flat while meters register more than what's actually flowing through, and utilities bill for that inflated volume.
Drought surcharges add another layer. California's Public Utilities Commission authorized recovery of over $1.39 million through quantity-based surcharges in 2025, with per-unit charges varying by service area.
For commercial and industrial users, these factors compound. Since sewer fees typically track metered water volume, any over-reading hits both charges simultaneously.

How Much Water Should a Household or Facility Use?
Context matters when evaluating whether your bill reflects normal usage or something worth investigating.
Residential benchmark: The EPA cites 82 gallons per person per day at home, meaning a two-person household should expect roughly 164 gallons daily under typical conditions.
Commercial and industrial facilities operate on a completely different scale:
- Hotels: median 102 gallons per room per day
- Hospitals: median 315 gallons per bed per day
- Commercial/institutional sector overall: 17% of all public water withdrawals nationally
Food & beverage plants, healthcare facilities, and manufacturing sites often use volumes that dwarf residential accounts entirely. At that scale, even a small measurement error becomes a real dollar figure. A 5% over-reading on a hospital's meter can add thousands of dollars a year to the bill.

How to Lower Your Water and Sewer Bill
The right strategy depends on whether you're managing a household or a facility.
For Homeowners
Quick wins that add up:
- Fix leaks: The EPA notes easily fixed household leaks can cut bills by about 10%. The average home wastes over 9,300 gallons a year to leaks
- Install WaterSense fixtures: WaterSense toilets use 20% less water than the federal standard and can save up to $170/year
- Adjust irrigation scheduling: A WaterSense-labeled controller can cut outdoor water use by up to 30%
For Businesses and Facilities
The usual advice is simple: use less water. That doesn't translate well to commercial operations. A hospital can't cut sterile processing cycles. A hotel can't tell guests to shower less. Cutting usage often means cutting revenue or service quality.
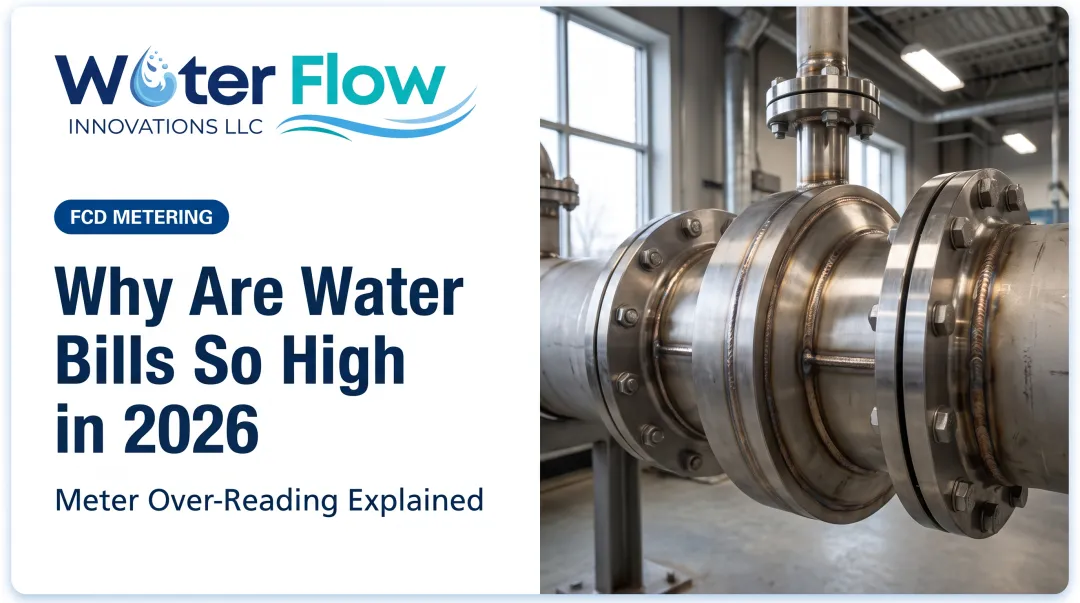
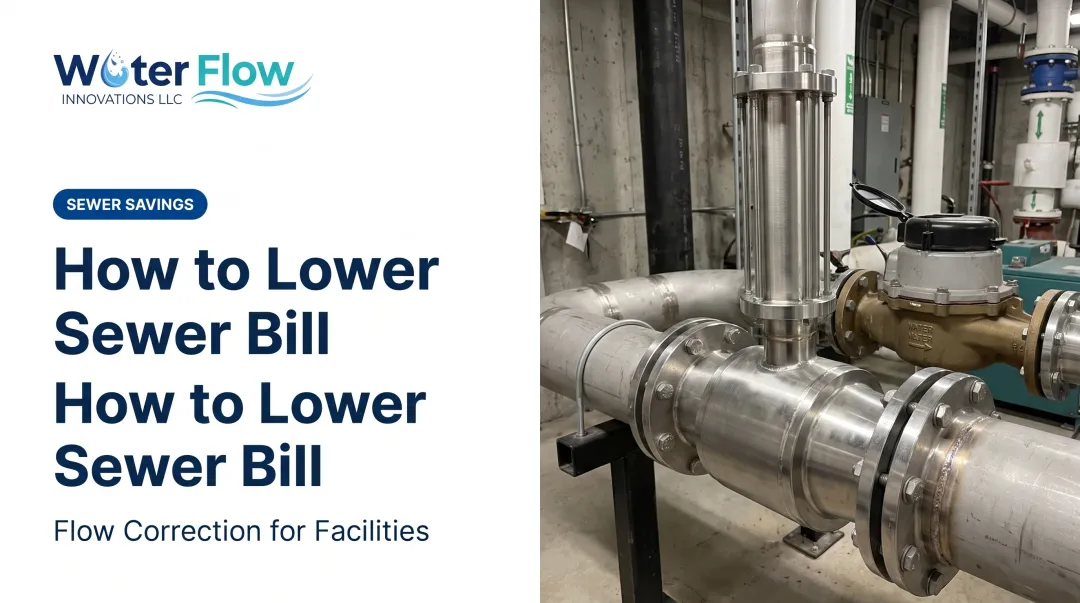
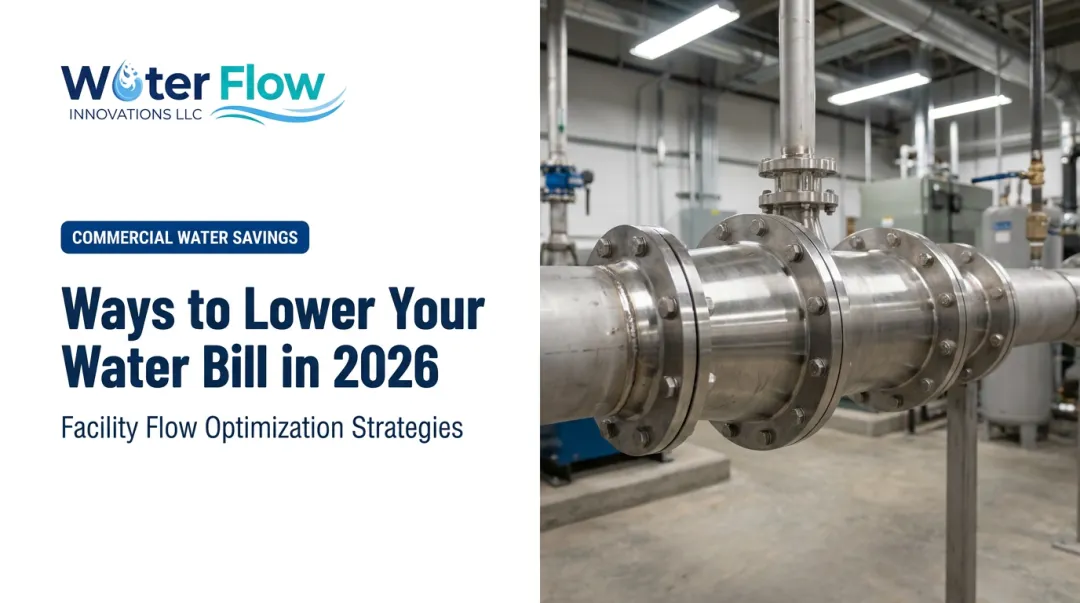
That's where correcting meter over-reading becomes the more practical lever. Water Flow Innovation offers a Flow Conditioning Device (FCD) that addresses the turbulence and air entrainment causing meters to over-register, without changing actual water consumption.
The FCD works through four coordinated components:
- Air and gas separation: Creates a homogeneous water column so meters register water, not air bubbles
- Pressure regulation: Reduces surges and water hammer that generate micro-bubbles
- Check valve: Prevents reverse flow and air re-entry
- Turbulence elimination: Slows velocity enough to prevent vortex formation at the meter

What this means for facility budgets:
- 5–30% average bill reduction, with a documented high of 46%
- Savings appear on the very next billing cycle, with no ramp-up period
- 90% of customers reach ROI in under 12 months
- No operational disruption: installation takes about an hour, downstream of the meter, with negligible pressure loss to internal systems
Trust Signals for Facility Managers
Before committing capital, facility managers typically want proof the product performs as claimed. The FCD carries:
- IAPMO, NSF, ANSI, CAN 61, KIWA, GMP, and SQF certifications
- A 6-month money-back guarantee (installation-excluded, original purchaser only)
- A lifetime transferable warranty that stays with the property through ownership changes
Each unit is custom-fabricated in 316L stainless steel for pipe sizes from NPS 1/2" to 12". It fits any meter type across hotels, hospitals, schools, manufacturing plants, and multifamily buildings.
Frequently Asked Questions
What is the average sewer bill in Pennsylvania?
A pure statewide sewer-only average isn’t published separately. Pennsylvania’s combined water and sewer bill averaged about $79/month in early 2026, below the national median, while local sewer rates vary sharply—Scranton and Dunmore, for example, moved to $95.01/month.
What is the average water and sewer bill in New Jersey?
No verified statewide combined median is published for New Jersey. The state is still grouped with higher-cost Northeast markets because of aging pipes and dense service areas.
What is the average monthly water bill in Michigan?
No independently verified 2026 statewide average is available for Michigan. Documented infrastructure replacement needs still drive many local rate increases.
What is the average monthly water bill in Florida?
A verified statewide figure isn’t published for Florida. Population growth and expanding municipal systems are pushing many local rates upward.
What is the average monthly water bill in North Carolina?
North Carolina’s average reached $223/month in the February 2026 doxo bill-pay snapshot, placing it among the higher-cost states.
How much water should a 2-person household use per day?
Based on the EPA's benchmark of 82 gallons per person daily, a two-person household should expect roughly 164 gallons per day under typical residential conditions.
Why does a commercial bill often exceed any published average?
Because averages assume the meter is accurate. Commercial connections run many demand sources at once, and the entrained air and turbulence they generate is registered as billable volume, so the bill reflects more than the facility actually received. Correcting that has produced documented reductions averaging 5–30%, with a highest documented single result of 46%.
What indicates a bill is inflated rather than simply high?
Metered consumption that no longer moves with production or occupancy, sewer charges out of proportion to actual discharge, and totals that stayed high after the utility fitted a replacement meter.