Every water meter has an accuracy range, defined by four values: Q1, Q2, Q3, and Q4. Get the sizing wrong, or ignore what's happening inside the pipe, and billing accuracy suffers. Facilities either underpay (and miss leaks) or overpay for water they never used.
Many facilities managers have never heard of Q1-Q4. Yet these values, standardized under ISO 4064-1:2024, govern every water bill a commercial or industrial account receives. This guide breaks down what flow rate means, how it's measured, what pushes real-world accuracy off the rails, and how to size and read a meter correctly.
Key Takeaways
- Q1-Q4 define a meter's accurate measurement range, standardized under ISO 4064-1:2024
- The R-ratio (Q3/Q1) determines how well a meter catches low flows and leaks
- Incorrect sizing causes under- or over-billing independent of actual usage
- Turbulence and air entrainment inflate readings even within a standard Q-rating
- Flow conditioning corrects over-registration without changing water usage or system performance
What Water Meter Flow Rate (Q1–Q4) Represents
Flow rate is the volume of water passing through a meter per unit of time, measured in gallons per minute (GPM), cubic meters per hour (m³/h), or liters per second (L/s). It's both a design spec (what the meter is built to handle) and an operating variable (what's actually flowing through it right now).
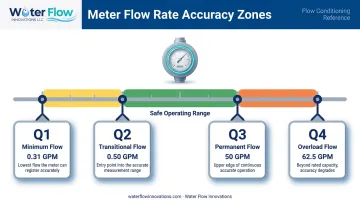
Under ISO 4064-1:2024, every meter carries four flow rate values that define its legal accuracy envelope:
- Q1 (Minimum Flow Rate) — the lowest flow the meter can register within its allowed error margin. This number matters for catching small drips and minor leaks before they become expensive ones.
- Q2 (Transitional Flow Rate) — the boundary between the low-flow and high-flow accuracy zones, calculated as 1.6 × Q1.
- Q3 (Permanent Flow Rate) — the flow the meter handles continuously and accurately. This is the number manufacturers and utilities use to size and select a meter.
- Q4 (Overload Flow Rate) — the peak flow tolerated briefly during surges, calculated as 1.25 × Q3.
Getting these thresholds right matters beyond compliance paperwork. A meter operating outside its accuracy envelope — particularly near Q1 or during turbulent flow conditions — can misregister usage, inflating water and sewer bills without any change in actual consumption.
A Worked Example
Say a meter is rated Q3 = 50 GPM with an R-ratio of R160 (meaning R = Q3/Q1 = 160).
- Q1 = Q3 ÷ R = 50 ÷ 160 = 0.31 GPM
- Q2 = 1.6 × Q1 = 1.6 × 0.31 = 0.50 GPM
- Q3 = 50 GPM (given)
- Q4 = 1.25 × Q3 = 1.25 × 50 = 62.5 GPM
That meter accurately measures anything from roughly a third of a gallon per minute up to 62.5 GPM in short bursts — but its reliable continuous-duty zone tops out at 50 GPM.
Flow Rate Ranges: GPM by Meter Size and the R-Ratio
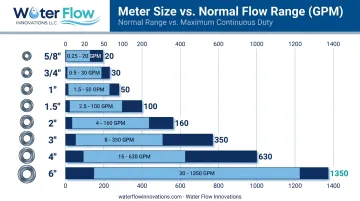
Flow capacity scales with meter diameter. Manufacturers and utilities publish standard GPM ranges for each size, though exact numbers vary by brand and meter technology.
| Meter Size | Typical Normal Range (GPM) | Max Continuous Duty (GPM) |
|---|---|---|
| 5/8" | 1 – 20 | 10 |
| 3/4" | 2 – 30 | 15 |
| 1" | 1 – 55 | 25 – 40 |
| 1.5" | 5 – 100 | 50 |
| 2" | 0.5 – 200 | 80 – 160 |
| 3" | 4 – 550 | 500 |
| 4" | 6 – 1,250 | 1,250 |
| 6" | 12 – 2,500 | 2,000 |
Figures compiled from Neptune T-10, Badger Recordall, Sensus OMNI, and Neptune MACH 10 published specifications. Actual ratings vary by manufacturer and meter type.
Understanding the R-Ratio
Raw GPM numbers only tell part of the story. The R-ratio (R = Q3/Q1) measures how wide a meter's accurate range is. A meter rated R160 measures accurately down to a much smaller flow than one rated R80, even at the same Q3.
- Higher R-ratio = better low-flow and leak sensitivity
- Lower R-ratio = narrower accurate range, more prone to missing small flows
The Safe Operating Zone
A facility's typical flow should sit between Q2 and Q3, never chronically near or below Q1, and never sustained near Q4.
- Oversized meters run near or below Q1 relative to their capacity, undercounting real usage
- Undersized meters run near Q4 too often, wearing out faster and risking inaccurate high-flow readings
Sizing methods also differ by technology. Mechanical and ultrasonic meters are sized by Q3, while electromagnetic meters, like the Badger M2000, are sized by fluid velocity (typically 0.10 to 39.4 ft/s) rather than a flat GPM figure.
Turbulent flow inside the pipe is one of the most common reasons meters drift outside their accurate range, which is why facilities experiencing chronic over-reading often look at flow conditioning at the meter as a fix.
Factors That Affect Real-World Meter Accuracy
Published Q1-Q4 values come from lab testing under controlled conditions. Real-world piping, pressure fluctuations, and installation quirks routinely push actual accuracy outside those published ranges.
Turbulence and Air Entrainment
Bends, pumps, partially closed valves, and improper installation all generate turbulent flow. That turbulence can spin a mechanical meter's measuring element faster than the actual water volume justifies — a phenomenon called over-registration.
Air entrainment compounds the problem. Most commercial meters can't distinguish air bubbles from water. Any air that reaches the measurement zone gets billed as water volume, whether the meter is displacement, turbine, or electromagnetic.
Installation Orientation and Straight-Pipe Requirements
Manufacturers specify strict installation conditions for a reason:
- Propeller and turbine meters typically need 10 to 30 pipe diameters of straight upstream pipe
- Compound meters need 4 to 8 diameters upstream, 2 downstream, depending on strainer use
- Ultrasonic meters like the MACH 10 need little to no straight pipe under AWWA C715, but manufacturers often still recommend 5 diameters as a best practice
- Electromagnetic meters require a full pipe with zero air bubbles — an uncovered electrode for just five seconds triggers a measurement error
Skip these clearances, and even a correctly sized meter drifts from its rated accuracy curve.
Wear, Mineral Buildup, and Aging
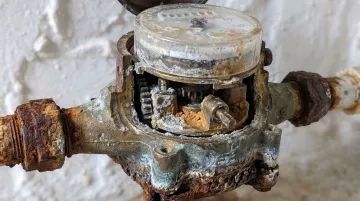
Sediment and scale buildup inside mechanical meters gradually increases internal friction and wears down moving parts. Most meters under-register over time as they age, per EPA research on drinking water losses — meaning older meters increasingly fail to register a rising share of actual flow, particularly at low-flow rates. That's the opposite direction of turbulence-driven over-registration, which is why isolating the real cause of a billing discrepancy matters.
Where Flow Conditioning Fits In
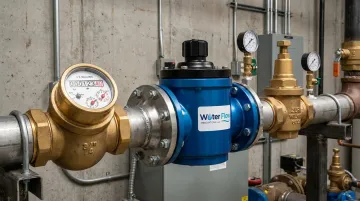
Turbulence and air entrainment are correctable at the source — unlike aging-related wear, which requires meter replacement. This is where Water Flow Innovation's Flow Conditioning Device (FCD) addresses a gap that meter sizing alone can't fix. The FCD is certified to IAPMO, NSF, ANSI, CAN 61, KIWA, GMP, and SQF, and installs immediately after the water meter using a four-part system:
- Air/gas separation — creates static back-pressure that forces entrained air out in the measurement zone
- Pressure regulation — smooths surges and water hammer that generate micro-bubbles in the first place
- Check valve — blocks reverse flow that could reintroduce air after initial correction
- Turbulence elimination — converts vortex flow into laminar flow through the meter
The device typically installs in about an hour, requires a brief water shutoff, and comes with a 6-month money-back guarantee and a lifetime transferable warranty. It corrects over-reading without altering actual water usage, pressure, or system performance.
How to Calculate and Measure Your Water Meter's Flow Rate
You don't need lab equipment to get a working estimate of your meter's flow rate.
- Read the totalizer at a starting point in time and note the exact reading
- Wait a fixed interval — an hour works well for most commercial accounts
- Read the totalizer again and subtract the first reading from the second
- Divide by elapsed time to get GPM or gallons per hour
Once you have that number, compare it against the meter's rated capacity to confirm your usage falls in a safe range. Most meters display their rated Q3 value (and sometimes the R-ratio) directly on the meter face or nameplate. Checking your calculated flow against that rating tells you whether typical usage falls in the safe Q2-to-Q3 zone.
A quick way to sanity-check your results:
- Flow well below Q2: normal for low-demand periods, no action needed
- Flow consistently near Q3: facility may be undersized for the meter or approaching capacity limits
- Flow that seems high relative to actual usage: worth investigating further, since turbulence at the meter can cause it to register more volume than actually passed
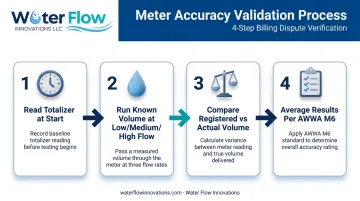
For billing disputes or suspected over-reading, a controlled test is the standard validation method. Run a known volume of water through the line and compare it against what the meter registers, at multiple flow rates (low, medium, high). AWWA M6 recommends averaging results across all three flow points for an overall accuracy figure.
If that test confirms your meter is registering more than it should, turbulent flow entering the meter is a common — and correctable — cause. A flow conditioning device addresses this by removing entrained air and stabilizing flow at the meter, which is the mechanism Water Flow Innovation's FCDs use to correct over-reading on commercial accounts.
What Happens When Flow Rates Fall Outside the Recommended Range
Operating outside the Q1-Q4 envelope has consequences at both ends of the scale.
Below Q1:
- Flow goes unmeasured or under-measured
- Real usage (or a leak) exists without being billed or noticed
- Small drips can run indefinitely undetected
At or above Q4, sustained:
- Mechanical wear accelerates
- Meter lifespan shortens
- Manufacturer accuracy guarantees can be voided
But staying within Q1-Q4 doesn't guarantee accuracy either. The common misconception: many facilities assume a meter's nominal Q3 rating guarantees field accuracy. It doesn't.
Installation conditions, turbulence, and entrained air can push registered usage above actual usage even while the meter operates squarely within its "normal" range on paper. This is the gap that flow conditioning devices address, correcting for turbulence-driven over-reading rather than the flow rate itself. Facilities questioning water bills that don't match their operational patterns often find the mismatch traced back to this exact issue.
Conclusion
Q1 through Q4, plus the R-ratio, aren't just numbers stamped on a meter face. They're the governing specification that determines whether your bill reflects reality. Correct sizing matters, but so does what's actually happening inside the pipe once that meter is installed — turbulence and air entrainment can skew readings even on a properly sized meter.
If your facility has noticed consistently high water and sewer bills despite normal, unchanged usage patterns, the answer isn't always found in consumption habits. It's often in meter accuracy. Water Flow Innovation's FCD corrects that inaccuracy, and the results show up fast:
- 5–30% average water and sewer bill reduction
- 46% highest single result documented to date
- 90% of customers reach full ROI in under 12 months
Savings typically appear on the very next billing cycle.
Frequently Asked Questions
How to calculate flow rate from a water meter?
Read the totalizer at two points in time, then divide the volume difference by the elapsed time to get GPM or gallons per hour. Most meters also print their rated Q3 value on the meter face as a reference point.
How many GPM will a 1" water meter flow?
A 1" meter typically runs a normal continuous range of about 1 to 55 GPM, with max continuous duty around 25 to 40 GPM depending on brand and meter type. Ultrasonic 1" models can rate up to 55 GPM continuous flow, depending on the manufacturer.
What is the flow rate on a water meter?
It's the range from Q1 (minimum) to Q4 (overload) that the meter is rated to measure accurately. Q3 is the key continuous-duty rating used for sizing and selection.
What is a normal water flow rate?
"Normal" typically means flow sitting between Q2 and Q3 for your installed meter size. For context, a standard showerhead runs about 2.5 GPM, and WaterSense-labeled models cap at 2.0 GPM.
What is Q3 on a water meter?
Q3 is the permanent, continuous flow rate a meter is designed to measure accurately long-term. It's the value manufacturers use to size and label meters, and it's usually printed directly on the meter face.
Why does my water meter read higher than my actual water usage?
Turbulence, air entrainment, and improper installation can cause a meter to over-register even while technically operating within its rated range. Water Flow Innovation's certified Flow Conditioning Device (FCD) is built specifically to correct this over-registration without changing your actual water usage.
Does the rated flow range account for air in the line?
No. Ratings describe how the meter handles water, but most meters register whatever passes through them and cannot separate entrained air and gas from water. A meter can sit comfortably inside its Q-range and still record phantom volume.
How quickly can that over-registration be corrected?
A licensed plumber or mechanical contractor fits a custom-built device at the supply connection in about an hour, with a brief water shutoff at the meter connection, and the corrected reading shows on the very next billing cycle.