
Best
20–40%
Up to ~50%
Under 0.8 psi
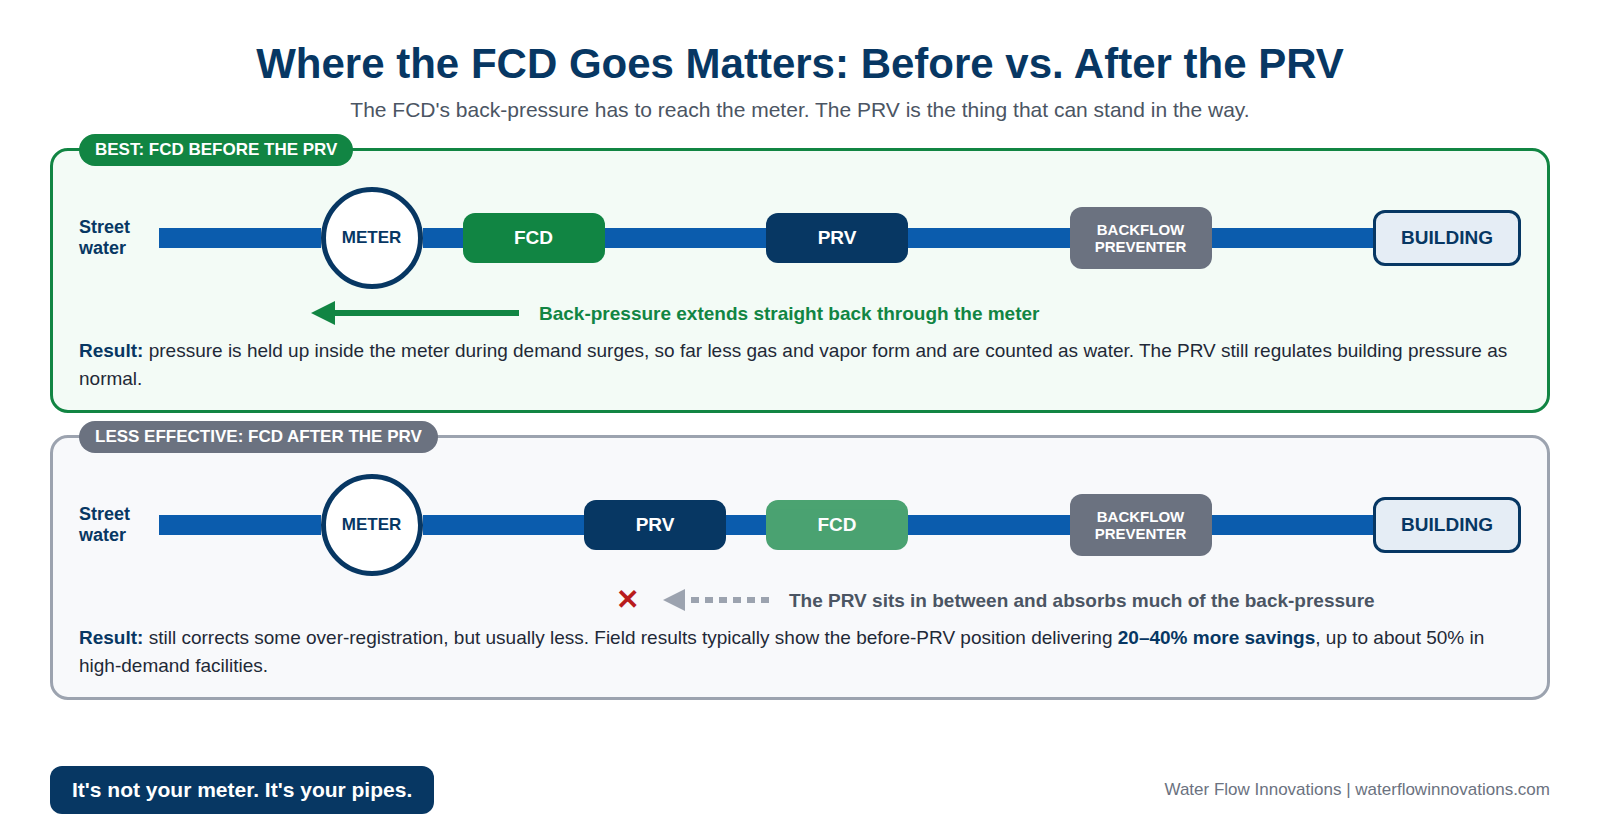
Direct answer: Install the Flow Conditioning Device (FCD) immediately after the water meter and before the pressure-reducing valve (PRV). The FCD corrects the meter reading with a small, controlled back-pressure that extends back through the meter during demand surges, and that back-pressure has to reach the meter to work. Before the PRV, it does. After the PRV, the PRV sits in between and absorbs much of it. Field results typically show 20–40% more savings in the before-PRV position, up to about 50% in high-demand facilities. The PRV still regulates building pressure as normal.
Before vs. After the PRV
Why Placement Changes the Result
1
The back-pressure has to reach the meter
During demand surges, water speeds up through the meter, pressure inside it drops, dissolved gas comes out of solution, and vapor forms. The FCD holds pressure up inside the meter so far less gas and vapor form and are counted as water. To do that, its back-pressure has to extend back through the meter.
2
The PRV can stand in the way
A PRV is built to control the pressure on its outlet side. Put the FCD after it, and the PRV sits between the FCD and the meter, absorbing much of the back-pressure before it gets there. The meter is left with less of the protection it needs during surges.
3
The PRV still does its job
With the FCD ahead of it, the PRV regulates building pressure exactly as before. Pressure loss across the FCD is under 0.8 psi across all flow conditions, so occupants and equipment see no practical difference.
The Physics: Why Placement Changes the Savings
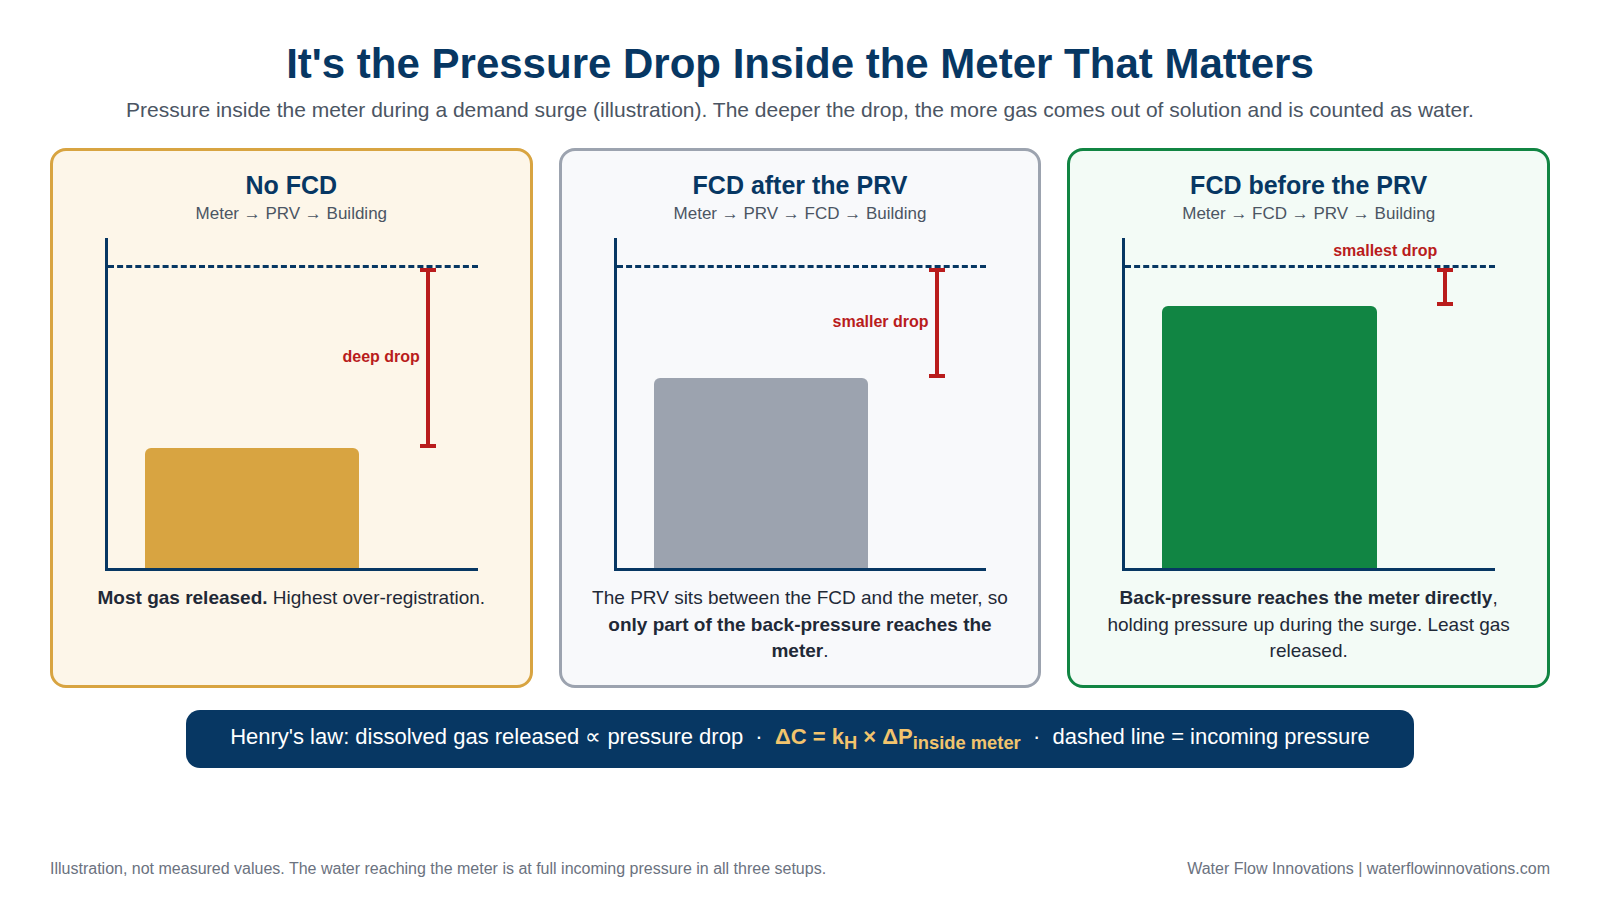
Over-registration comes from the pressure drop inside the meter during a demand surge. Three standard formulas describe it:
1
Faster surges
v = √(2ΔP / ρ)
When valves open, water accelerates according to the pressure available to push it. Higher incoming pressure means faster water through the meter during a surge.
2
Bigger pressure drop
ΔP = K × ½ρv²
The pressure drop inside the meter grows with the square of velocity. Twice the speed means about four times the drop.
3
More gas released
ΔC = kH × ΔP
By Henry’s law, the dissolved gas that comes out of solution is proportional to the pressure drop. The meter counts that gas, and the vapor that forms, as water.
4
Sudden demand drops pressure further
ΔP = ρ × a × Δv
Joukowsky equation. When a valve opens or a pump starts, a pressure wave travels through the pipe. Its size (ΔP) equals water density (ρ) times wave speed (a) times the change in velocity (Δv). Even a 1 ft/s change creates a wave of about 50 psi, briefly dropping pressure inside the meter. Installed before the PRV, the FCD’s back-pressure reaches the meter to hold pressure up through these surges.
An Example: 120 psi Before the PRV, 80 psi After
Many commercial buildings receive higher street pressure than their plumbing needs, so the PRV steps it down.
120 psi
At the meter and the FCD, when the FCD is installed before the PRV
80 psi
At the FCD, when it’s installed after the PRV
Same meter
Either way, the meter itself still sees the full incoming pressure and the same demand surges
What to Expect From the Best Setup
How much more the before-PRV position typically saves, compared with the same FCD installed after the PRV.
| Situation | More savings vs. after the PRV | What it usually looks like |
|---|---|---|
| Conservative | 10–20% | Lower demand, moderate pressure, steadier flow |
| Typical | 20–40% | Most commercial and industrial buildings |
| High demand | Up to about 50% | Frequent surges: CIP, wash systems, irrigation, booster pumps, many fixtures opening at once |
When the FCD Has to Go After the PRV
Sometimes there isn’t room between the meter and the PRV. The FCD still corrects part of the over-registration after the PRV, just usually less. Where it’s practical, relocating the PRV a short distance downstream to make room for the FCD delivers deeper long-term savings and a shorter payback. A site survey shows which option fits your service line.