
Water Service Line Components
How Each Part of Your Water Service Line Affects Meter Over-Registration
11
Up to 30%
Under 0.8 psi
6-Month
Direct answer: Meter over-registration happens when water moves through the meter fast enough that pressure inside it drops, dissolved gas comes out of solution, and vapor forms. The meter counts that volume as water. Anything in the service line that makes velocity jump suddenly, or makes pressure swing, increases how often and how much this happens. Booster pumps, quick-closing valves and simultaneous demand, burst equipment, and undersized pipe or meters have the largest effect.The physics is simple: pressure drop rises with the square of velocity.
ΔP = K × ½ρv² Double the speed of the water and the pressure drop roughly quadruples.
Your Service Line, Part by Part
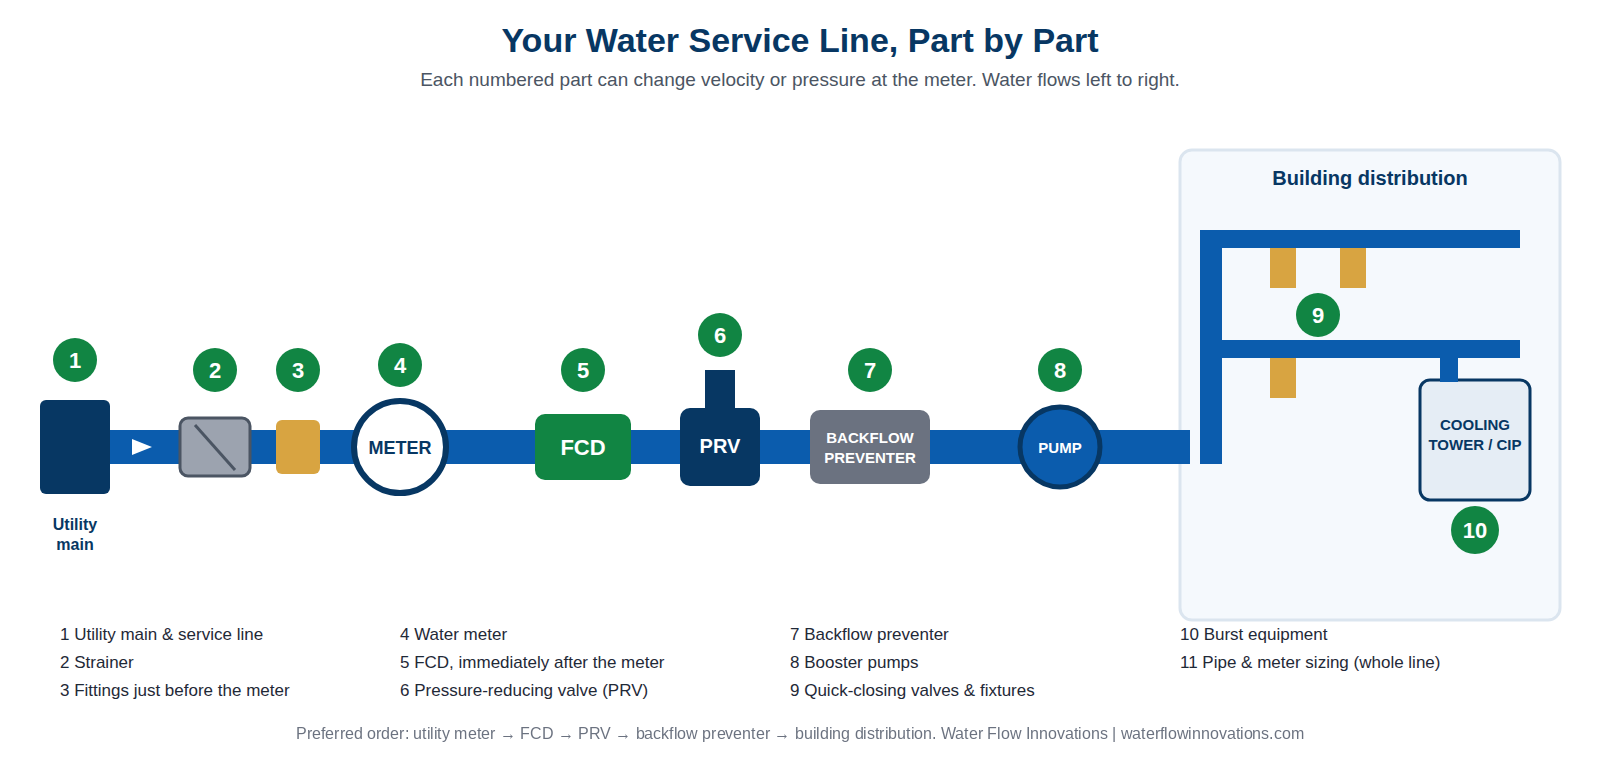
From the utility main to your building, each numbered part below can change velocity or pressure at the meter. Each number in the diagram matches a numbered section below.
How Each Part Affects Over-Registration
Each part is rated by its typical effect. Real results depend on how the parts work together at your site, which is why the Savings Calculator models your building hour by hour.
Utility main and service line
Effect: Moderate, comes and goes
How it contributes: Supply pressure isn’t constant. When it sags during neighborhood peak hours, the water reaching your meter already starts at lower pressure, so less of a velocity jump is needed before gas comes out of solution. After a main break, flushing, or repair work, gas can also be carried into the line and through the meter. Independent laboratory testing of a simulated main break measured meter error of about 35% while gas passed through.
What you’ll notice: Bills spike after utility work in your area; cloudy water that clears from the bottom up; pressure that drops at certain times of day.
What helps: Ask your utility about scheduled work and typical pressure at your service. Flushing fixtures after a main repair clears gas from the building side. An FCD immediately after the meter holds pressure up through the meter when supply pressure sags.
Strainer
Effect: Moderate when clogged
How it contributes: A strainer partly blocked with scale or debris narrows the flow path right at the meter inlet. Water speeds up through the opening and pressure drops as it enters the meter, exactly where you don’t want it. The effect grows as the strainer loads up between cleanings.
What you’ll notice: Over-registration that creeps up over months; a large pressure difference across the strainer at high flow.
What helps: Inspect and clean strainers on a schedule. Ask the utility, since they often own the strainer on the utility side of the meter.
Fittings just before the meter
Effect: Moderate
How it contributes: What matters is the water entering the meter. Fittings just upstream create swirl and uneven velocity across the pipe, so water arrives at the meter with turbulence and local high-velocity spots that lower pressure and help gas form inside it. Fittings after the meter matter far less: gas and vapor that form downstream are never counted, which is why meter makers typically call for a longer straight run before the meter than after it.
What you’ll notice: Elbows, reducers, or valves crowded against the inlet side of the meter in a tight vault or mechanical room; noise or vibration at the meter during high flow.
What helps: Where practical, follow the manufacturer’s straight-pipe recommendation ahead of the meter and use long-radius elbows. These layout fixes improve the flow entering the meter; the FCD addresses what the meter records.
The water meter itself
Effect: Moderate, depends on type
How it contributes: Each meter type has an internal flow path that speeds water up. Positive displacement meters push water through a nutating disc or piston. Turbine meters spin a rotor in the flow. Compound meters switch between a low-flow and a high-flow element, and the changeover point can be abrupt. Wherever the internal path narrows or turns, velocity rises and pressure drops. A meter in good condition still records gas and vapor as water, which is why a meter can pass its accuracy test and still over-register in service.
What you’ll notice: Metered volume that won’t reconcile with submeters or process data; a meter that “tests fine” while bills stay high.
What helps: Meter testing confirms the meter is accurate with water only. It doesn’t show what happens under real surges. Hold pressure up through the meter during demand surges.
The Flow Conditioning Device (FCD)
Effect: The correction
How it contributes: The FCD doesn’t change how much water your building uses. It creates a small, controlled back-pressure that extends back through the meter, holding pressure up during demand surges so far less gas and vapor form inside the meter. Pressure loss across the FCD is under 0.8 psi across all flow conditions.
The Results: This is where the correction happens: on the next full billing cycle, the meter is recording water rather than water plus gas and vapor.
Placement: Preferred order: utility meter → FCD → PRV → backflow preventer → building distribution. Installing after the PRV is a fallback when site conditions require it, and it typically reduces results. The FCD corrects the meter reading; it doesn’t fix turbulence elsewhere in the building.
Pressure-reducing valve (PRV)
Effect: Low to moderate, indirect
How it contributes: Because it’s downstream, a PRV doesn’t lower the pressure at the meter directly. It contributes in two indirect ways. When demand spikes, it opens quickly and lets a surge of flow rush through the meter. And a PRV that “hunts” (opening and closing repeatedly) sends pressure swings back through the meter, because water is nearly incompressible. A calm, well-maintained PRV adds little.
What you’ll notice: Chattering, humming, or banging at the PRV; pressure gauges that swing when fixtures open and close.
What helps: Service or replace a PRV that hunts. Install the FCD before the PRV so the meter sees steadier pressure.
Backflow preventer
Effect: Low to moderate
How it contributes: These assemblies take a meaningful pressure loss as water passes through, and that loss grows as flow increases. Their check valves can also snap shut when flow stops suddenly, sending a pressure wave back toward the meter. A backflow assembly also turns the building into a closed system, so thermal expansion and pressure swings have nowhere to go.
What you’ll notice: Banging when large valves close; relief valve discharge on an RPZ during pressure swings.
What helps: Keep assemblies tested and maintained as your code requires. Address water hammer at its source (see quick-closing valves).
Booster pumps
Effect: High
How it contributes: This is one of the strongest contributors. When a booster pump starts, it suddenly pulls water through the meter at a high rate. Velocity through the meter jumps, and pressure drop grows with the square of velocity: double the flow speed and the pressure drop roughly quadruples. The pump’s suction also lowers pressure in the line feeding it, and the meter sits on that line. Lower pressure inside the meter lets dissolved gas come out of solution and vapor form, and the meter counts that volume as water. Every pump start repeats it.
What you’ll notice: Bills that rose after pumps were added or replaced; pumps cycling on and off frequently; pressure dips at the meter when pumps start.
What helps: Variable-speed drives and soft starts ramp flow up gradually and reduce the surge. Hydropneumatic tanks reduce cycling. The FCD holds pressure through the meter during the surges that remain.
Quick-closing valves, fixtures, and simultaneous demand
Effect: High
How it contributes: Demand doesn’t rise smoothly. When many fixtures open at once, flow through the meter jumps in seconds. When fast-acting valves slam shut, they create water hammer: pressure waves that travel back toward the meter. Both the sudden opening and the sudden closing create the rapid pressure changes that let gas and vapor form inside the meter.
What you’ll notice: Banging pipes; sharp peaks at shift changes or meal service; bills that track activity peaks rather than total use.
What helps: Slow-closing valves, water hammer arrestors, and staggered cycles reduce the shocks. The FCD steadies pressure through the meter during the peaks.
Burst equipment
Effect: High
How it contributes: These systems call for large volumes on a cycle, often at full flow the moment they start. Each call is a sudden velocity jump at the meter, repeated many times a day. Facilities with several of these systems can have the meter running at high velocity for a large share of the day.
What you’ll notice: Bills that rise with production or cooling load faster than the actual water used; usage that comes in sharp spikes on interval data.
What helps: Stagger cycles where you can, and avoid starting several systems at once. The FCD holds pressure through the meter during each burst.
Pipe and meter sizing
Effect: High
How it contributes: Velocity is flow divided by pipe area, so a smaller pipe or meter means faster water for the same demand. A service or meter sized for an older, smaller load runs at high velocity during today’s peaks, which is when over-registration is greatest. An oversized meter does the opposite: water moves slowly and steadily, and over-registration is usually small.
What you’ll notice: Building additions or new equipment on the original service; meters running near their rated capacity at peak.
What helps: An engineer can check whether the service and meter suit today’s peak demand. Our Savings Calculator estimates velocity at your meter hour by hour.
At a Glance
The parts with the largest effect are the ones that make velocity jump suddenly at the meter.
| Part of the line | Typical effect on over-registration |
|---|---|
| 1. Utility main and service line | Moderate, comes and goes |
| 2. Strainer | Moderate when clogged |
| 3. Fittings just before the meter | Moderate |
| 4. The water meter itself | Moderate, depends on type |
| 5. The Flow Conditioning Device (FCD) | The correction |
| 6. Pressure-reducing valve (PRV) | Low to moderate, indirect |
| 7. Backflow preventer | Low to moderate |
| 8. Booster pumps | High |
| 9. Quick-closing valves, fixtures, and simultaneous demand | High |
| 10. Burst equipment | High |
| 11. Pipe and meter sizing | High |
Where the FCD belongs
See How This Applies to Your Building
Over-Reading Scorecard
Seven quick questions, about a minute. See which of these conditions your facility has.
Water & Sewer Savings Calculator
Model your building’s 24-hour flow, velocity at your meter, and estimated bill reduction.
See Exactly How the FCD Works
Installation, certifications, and the science behind correcting the meter reading, all in one place.